Species Suitability Maps
Forb
The Contiguous USA
|
Climate Factors |
Soil Factors |
All Factors Combined |
|---|---|---|
|
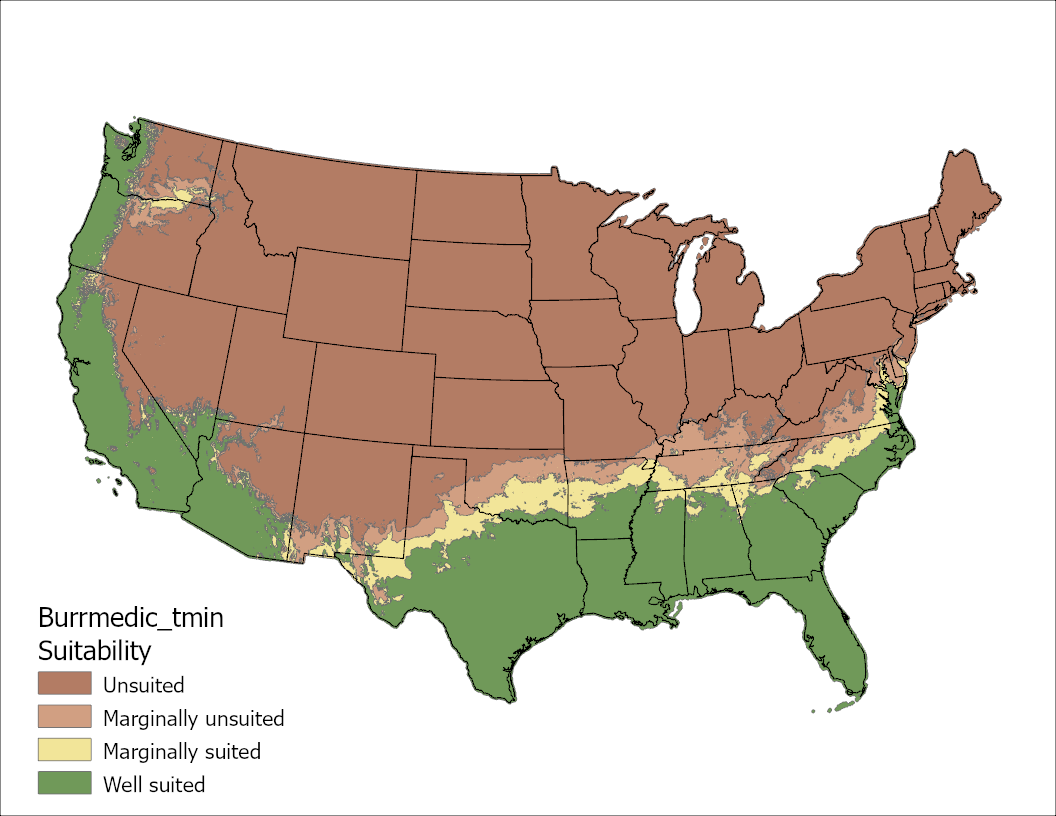
Minimum Temperature Image
|
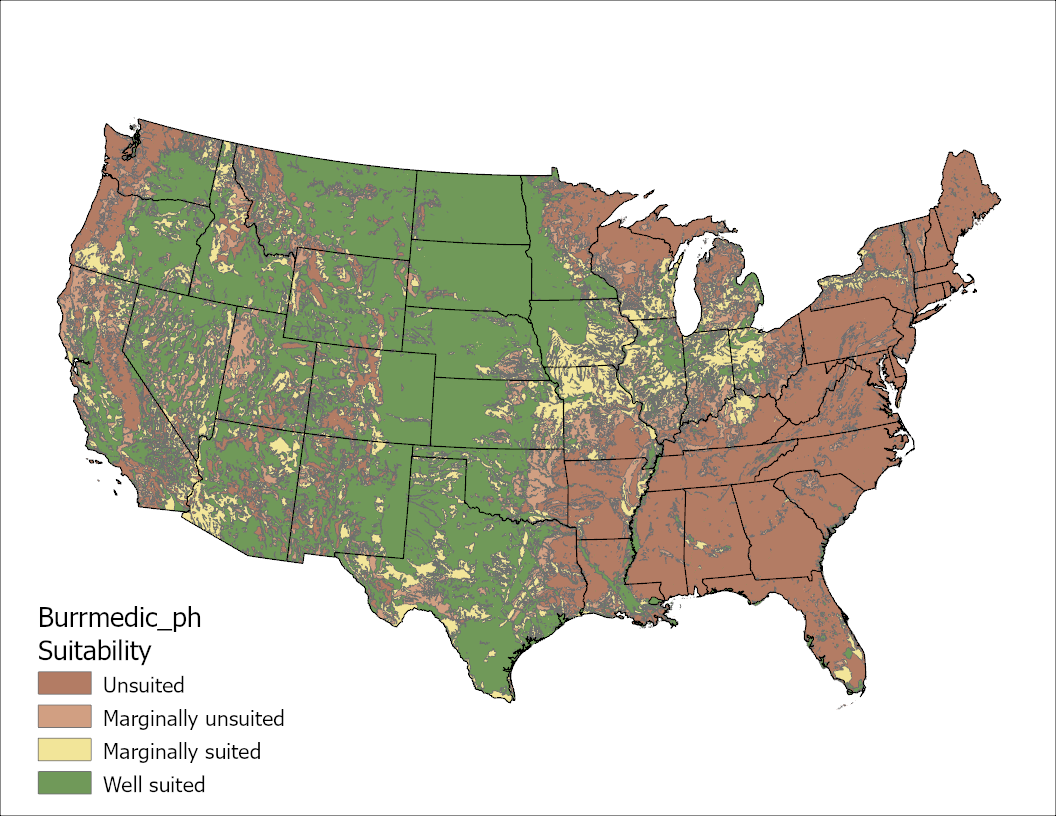
pH Image

|
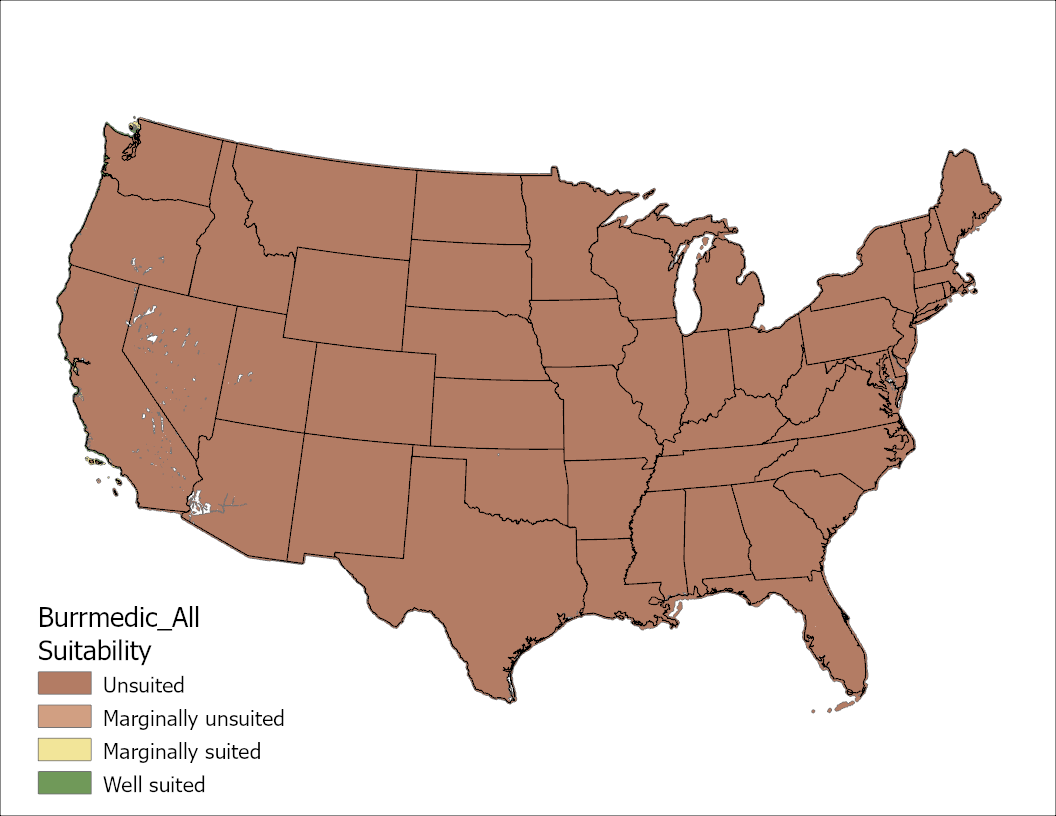
Climate and Soil Image

|
|
Maximum Temperature Image
|
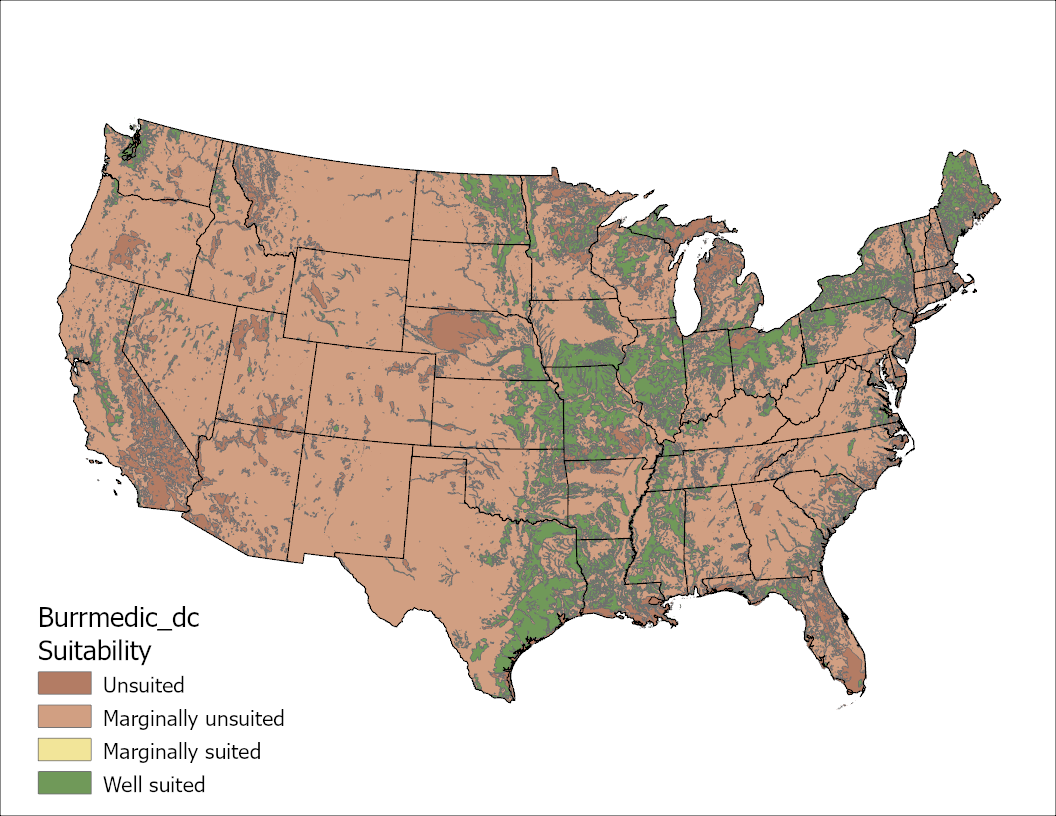
Drainage Image

|
All Soil Image

|
|
Precipitation Image
|
Salinity Image

|
All Climate Image
|
Click on the thumbnail image to view a larger map.


Grass
Suitability Maps
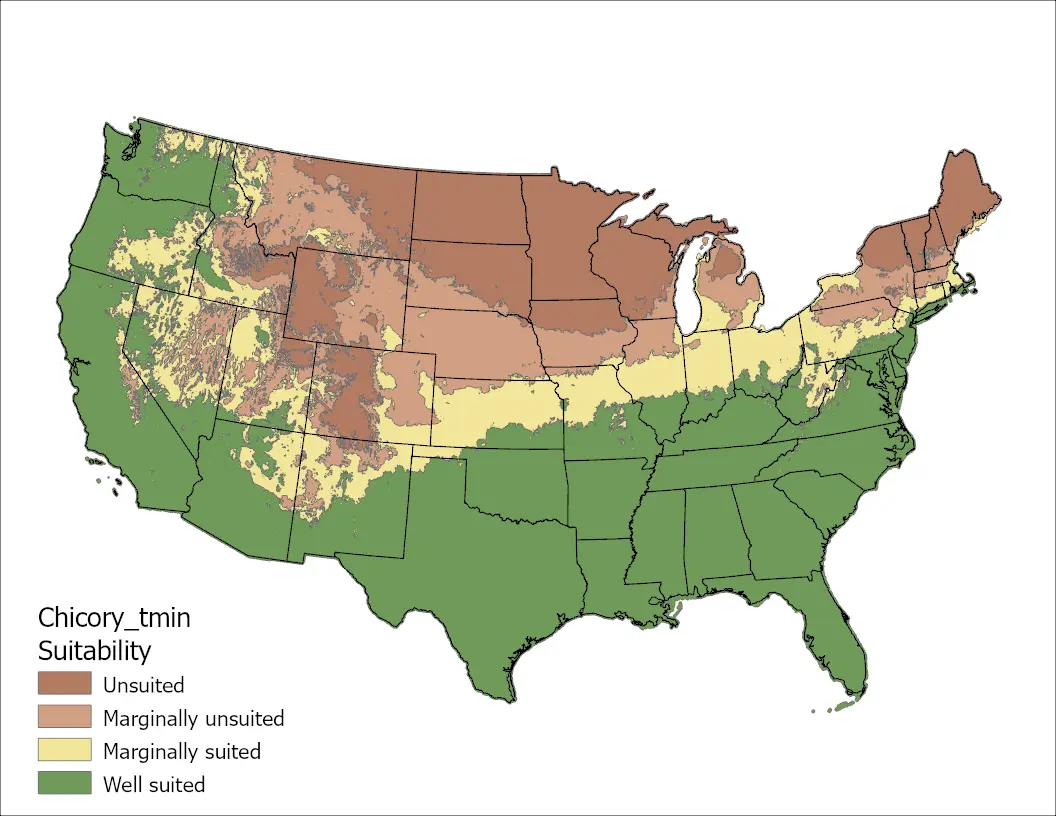
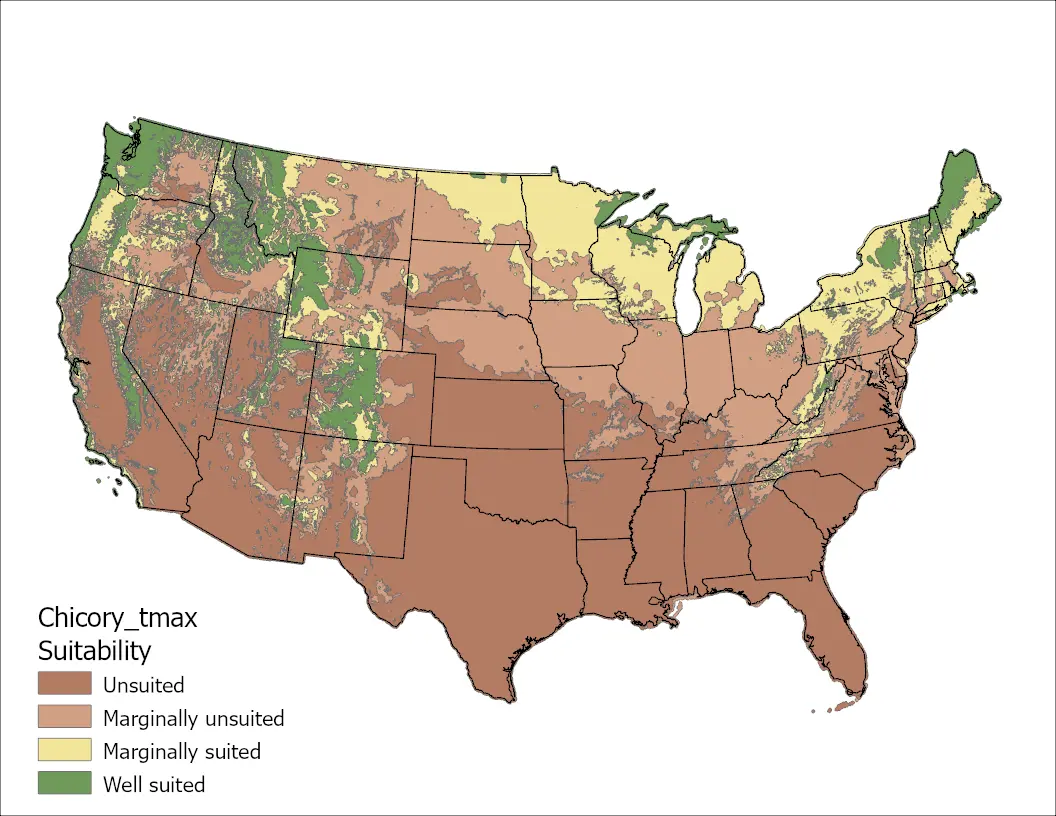
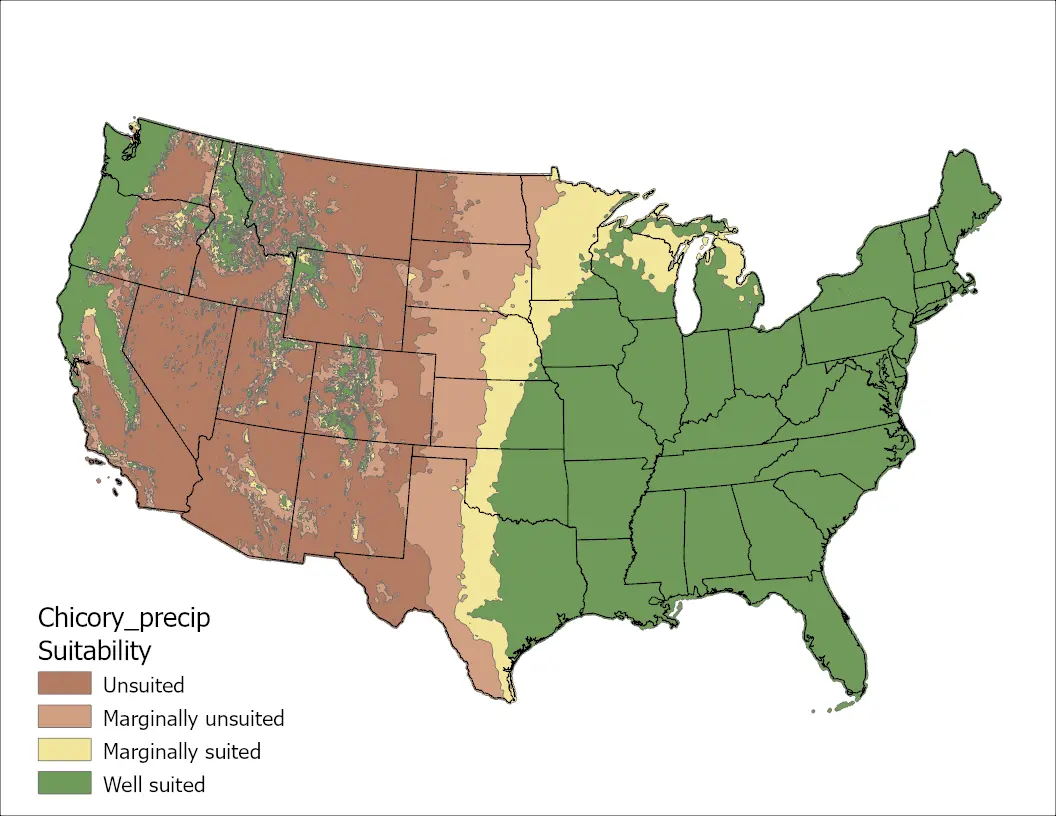
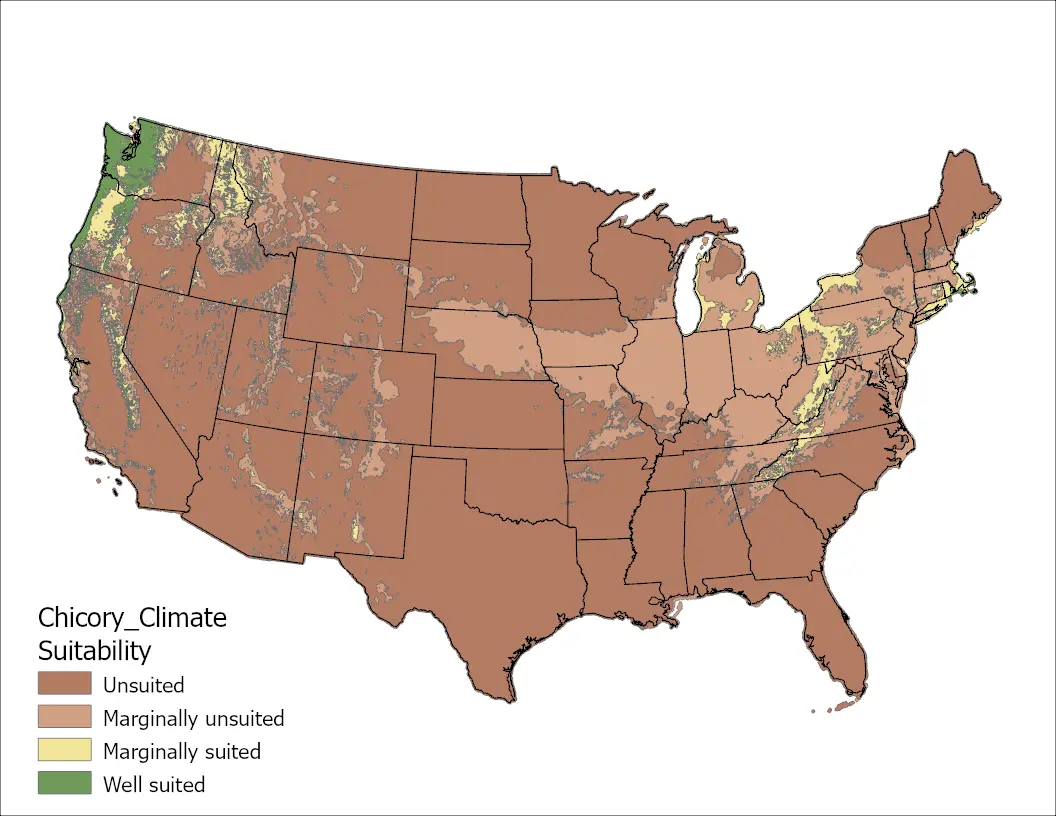
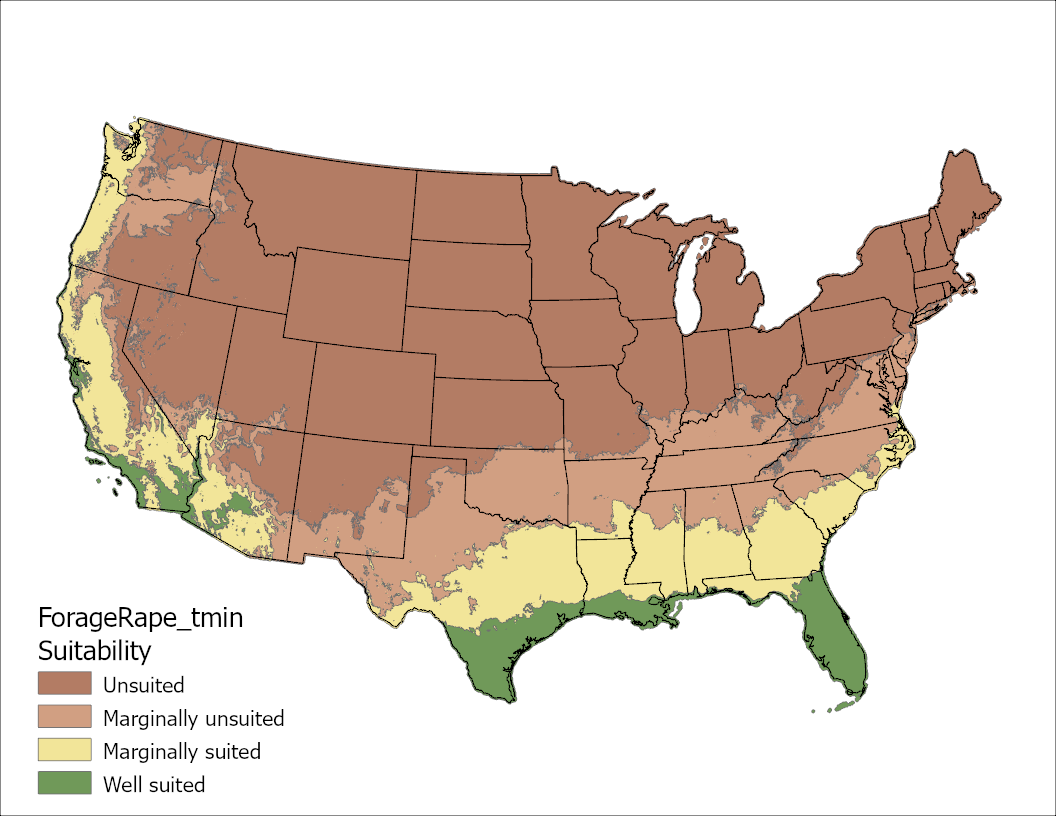
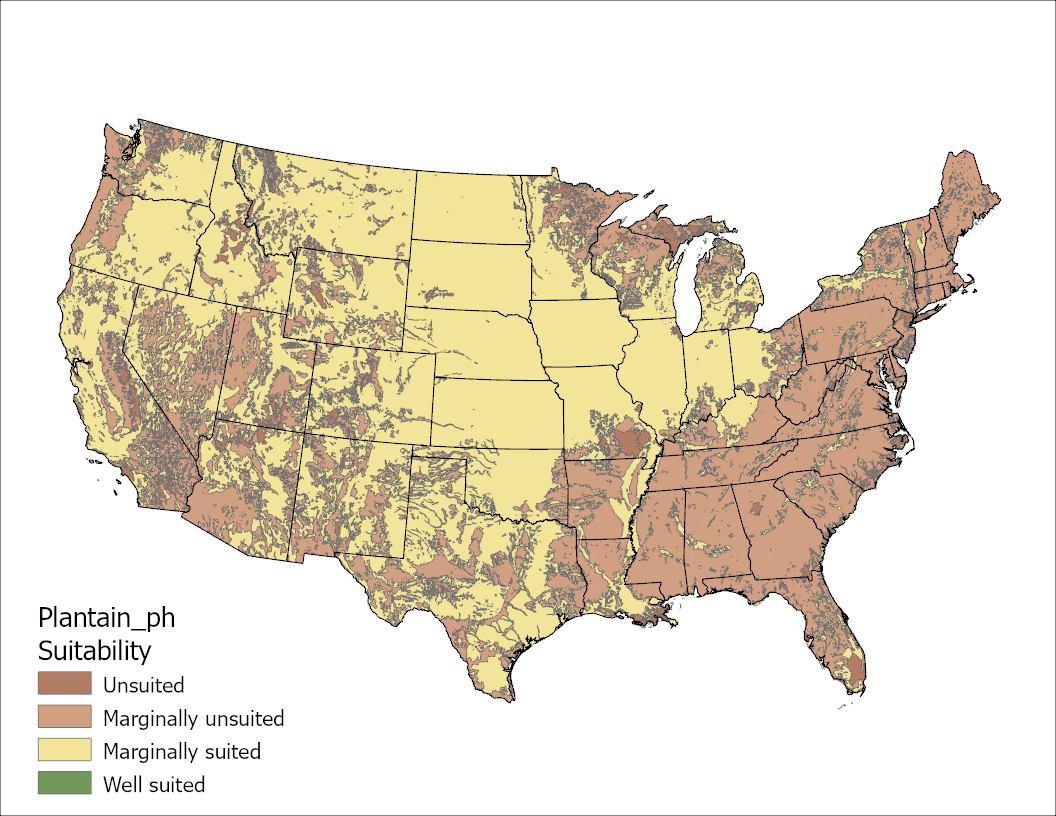
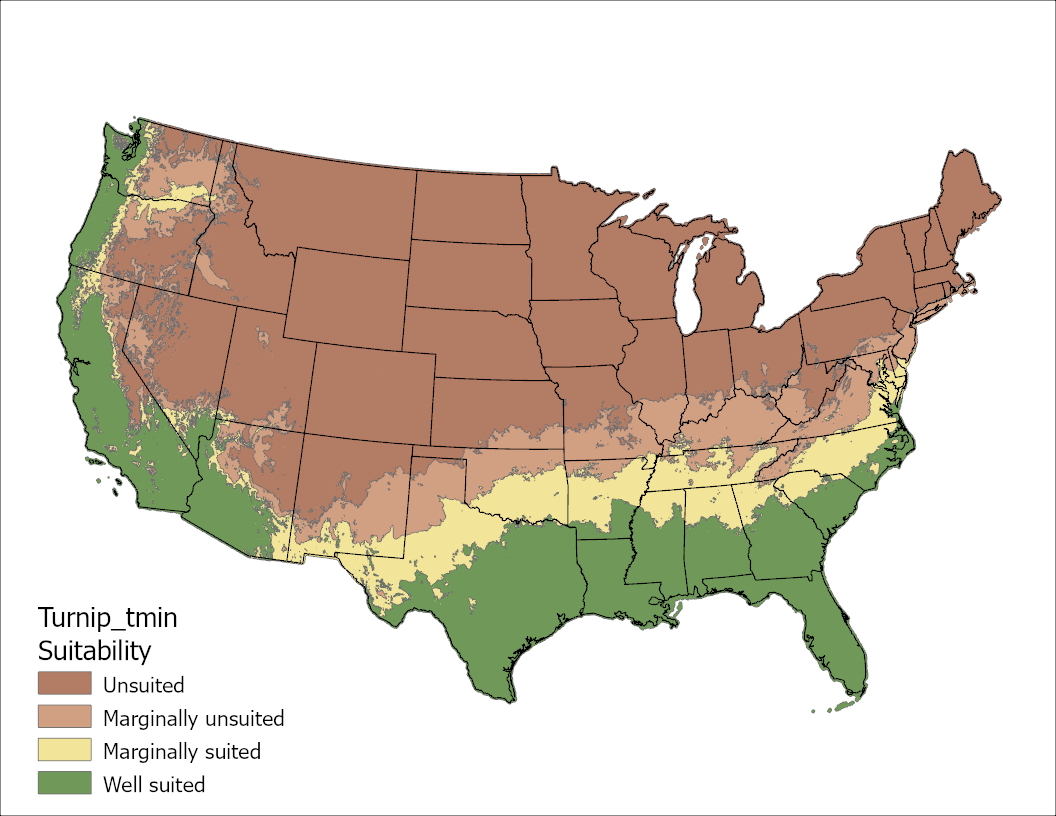
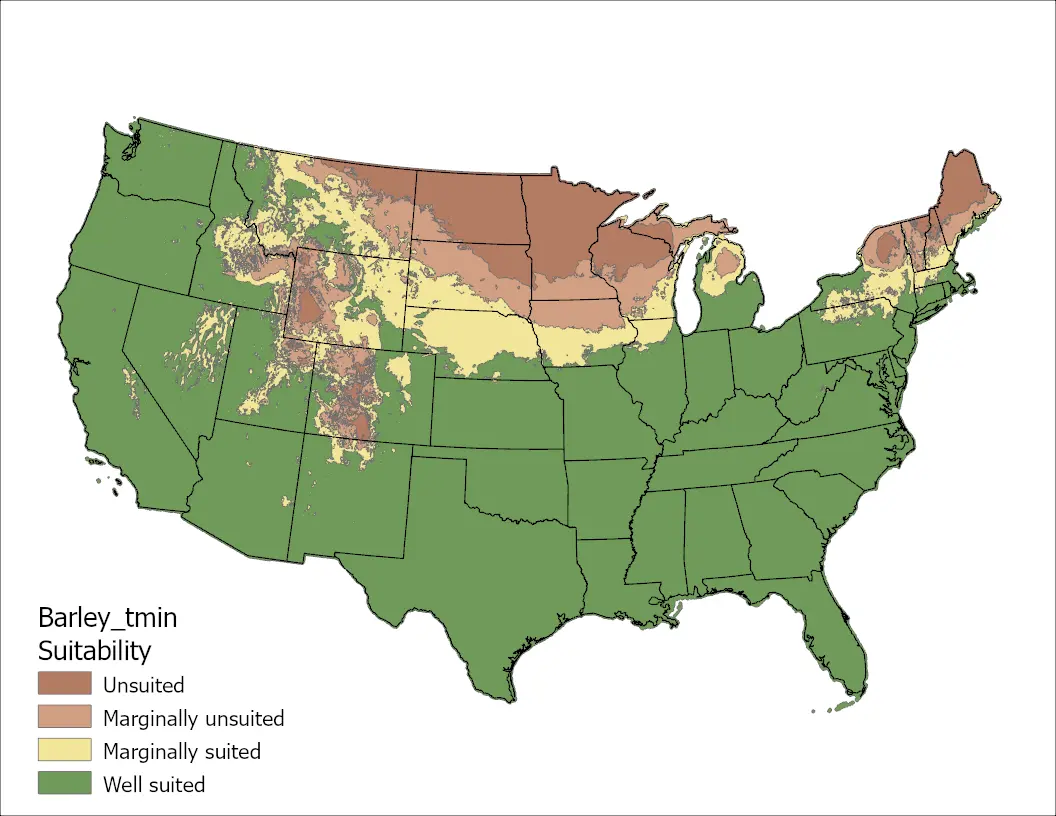
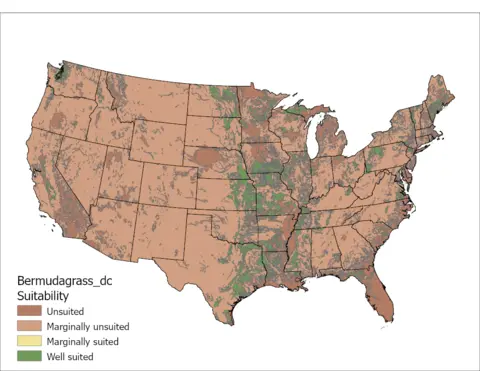
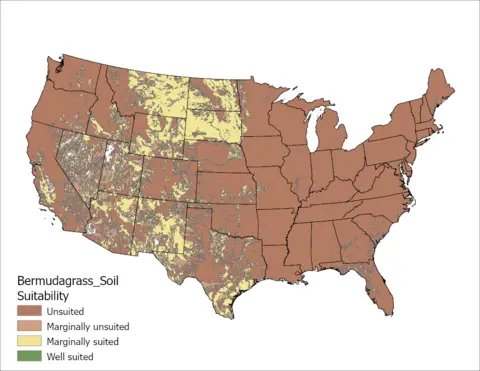
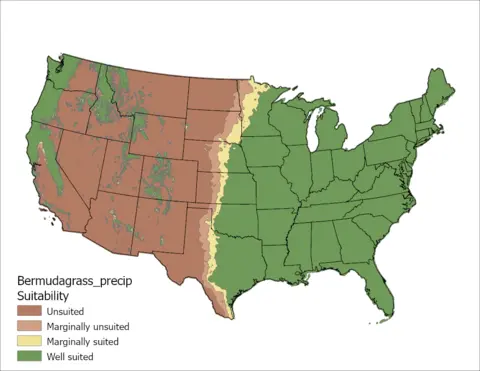
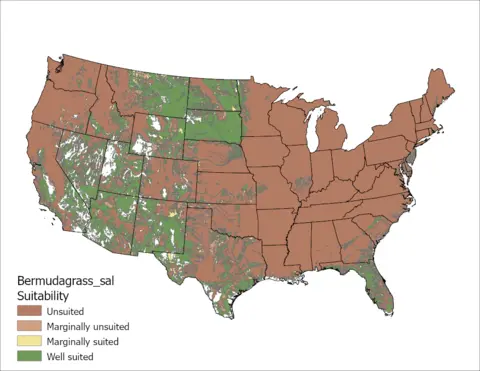
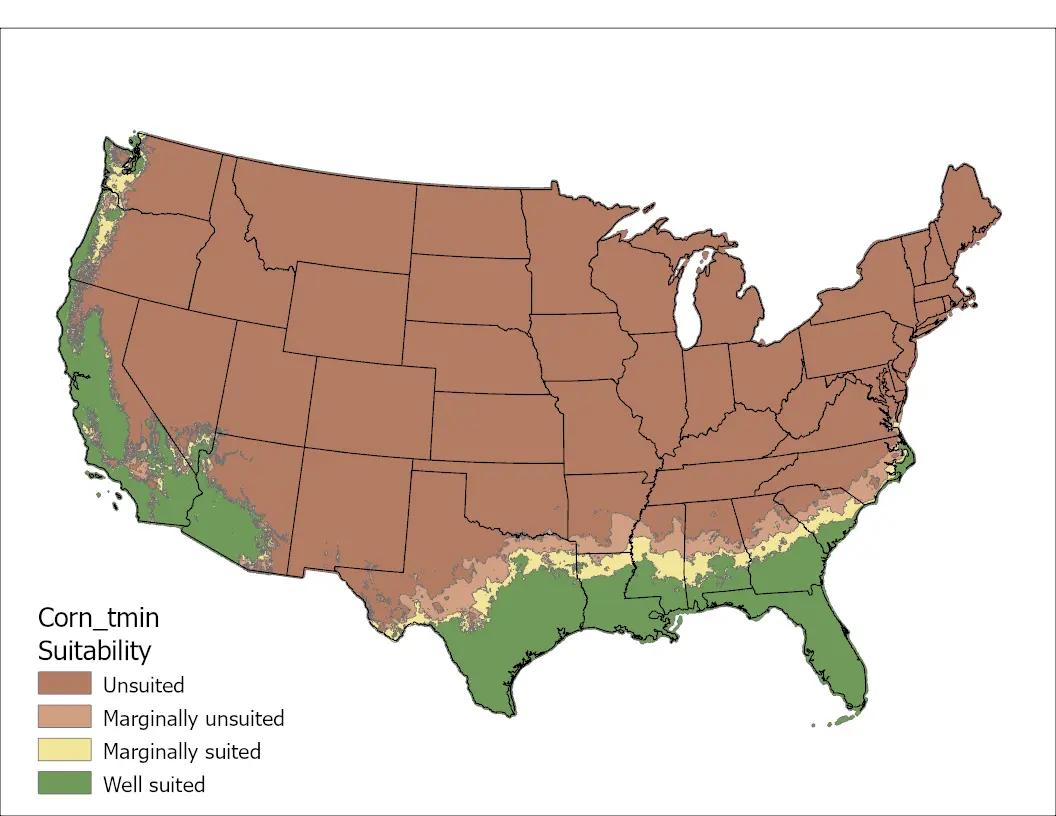
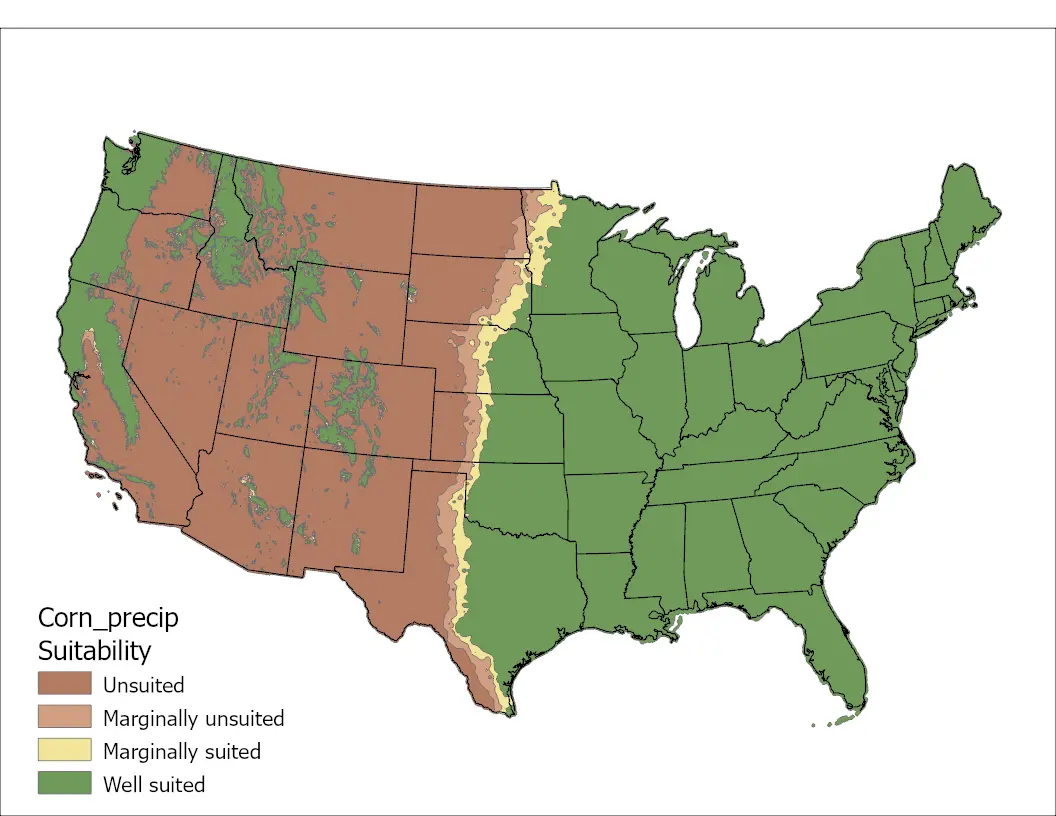
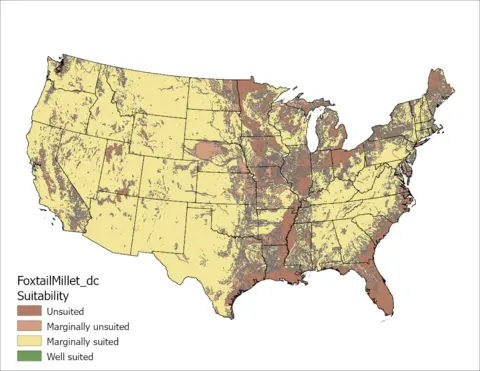
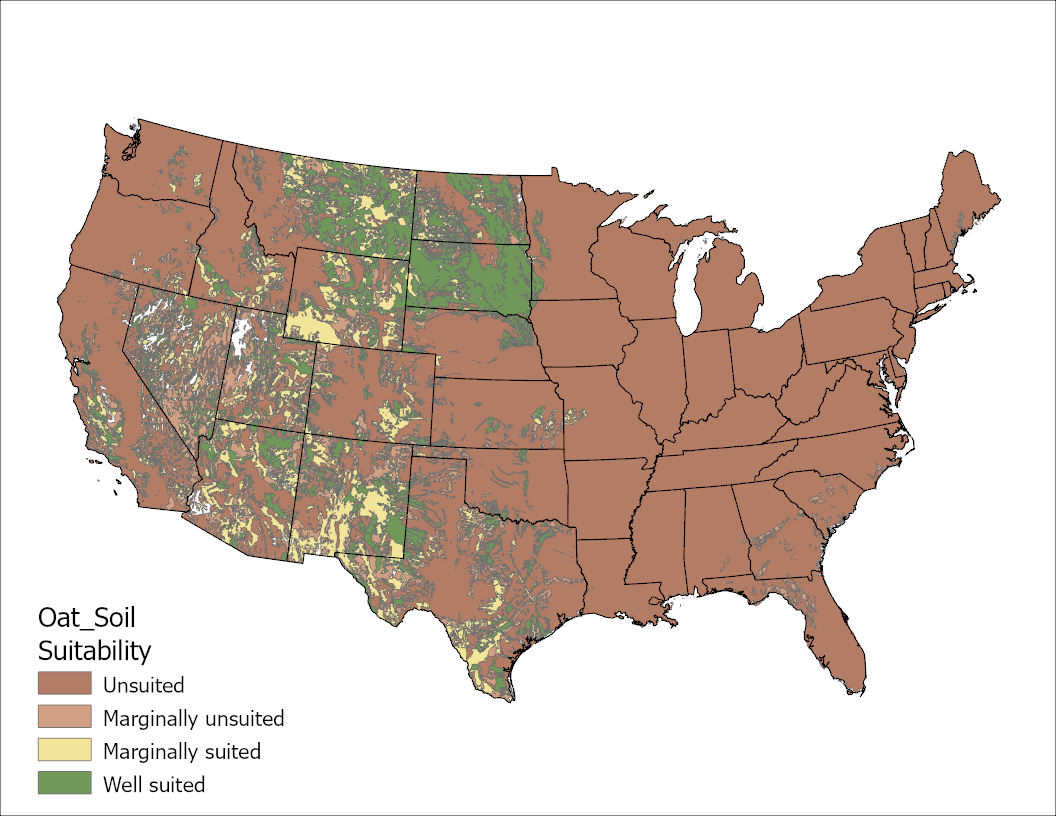
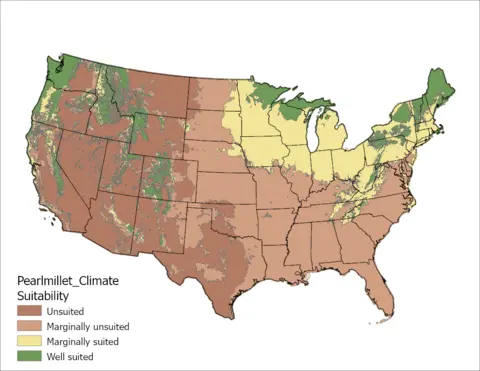
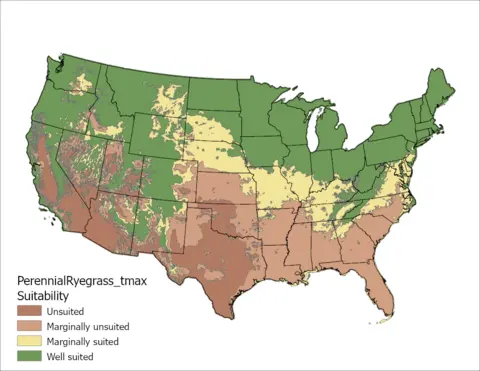
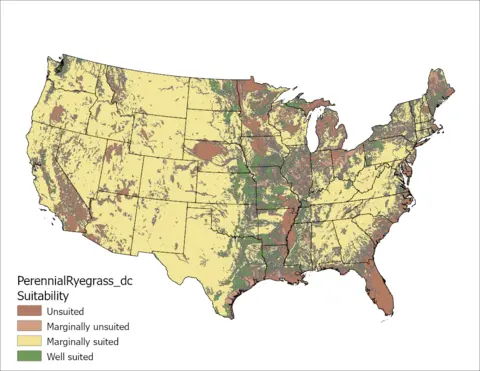
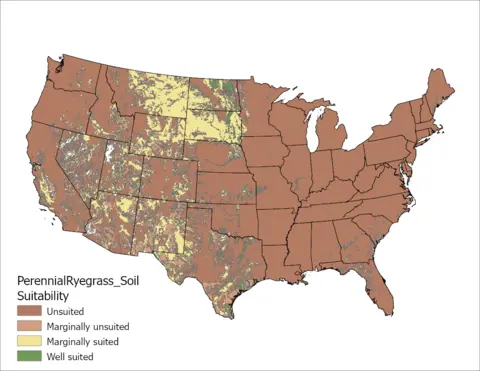
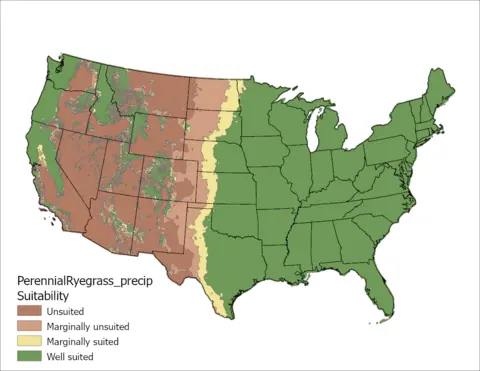
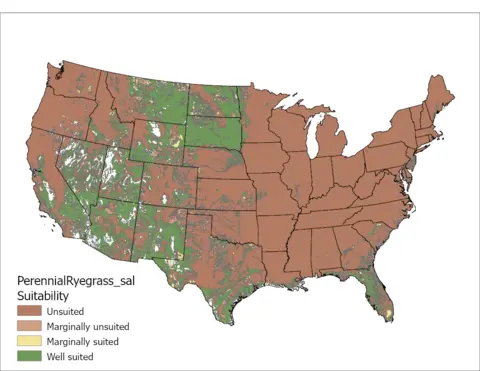
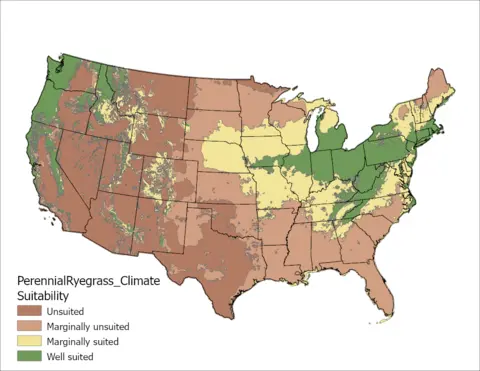
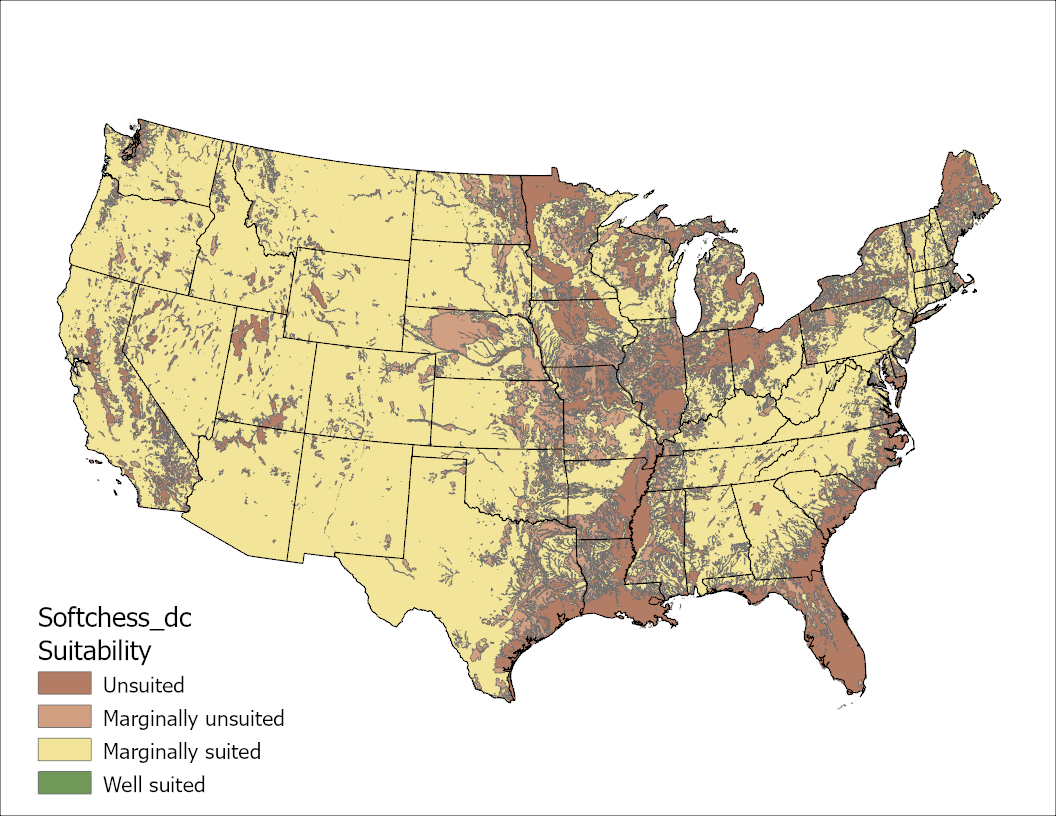
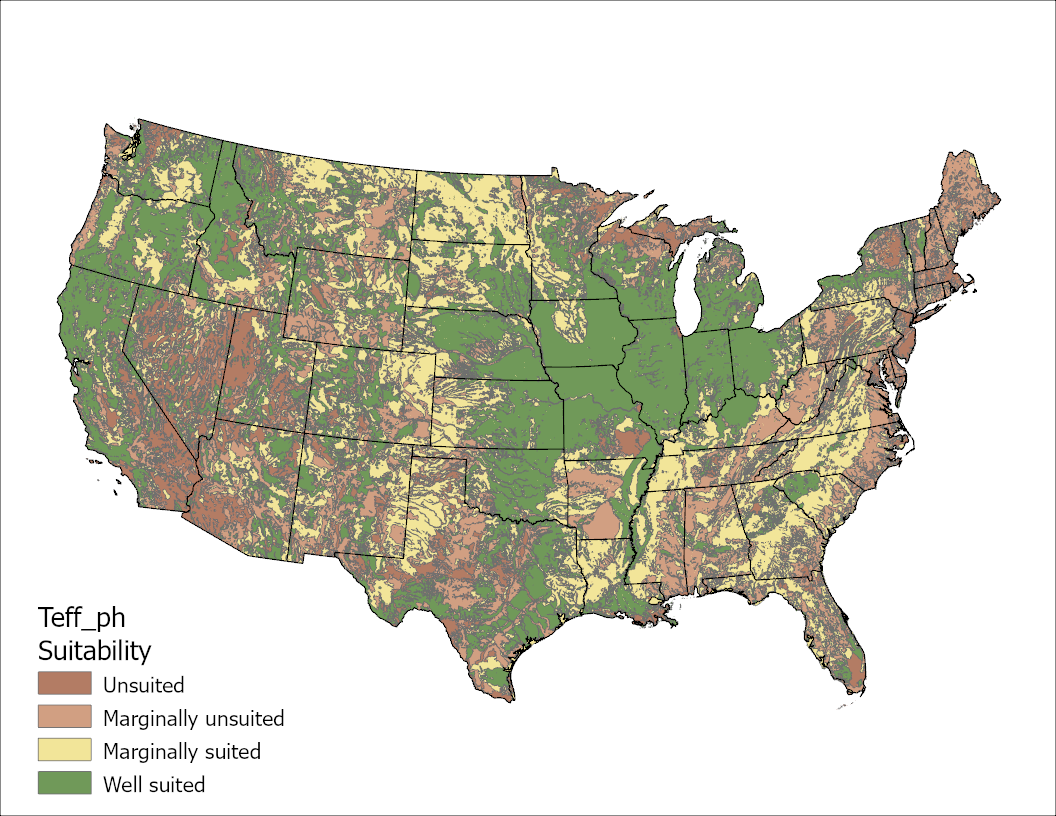
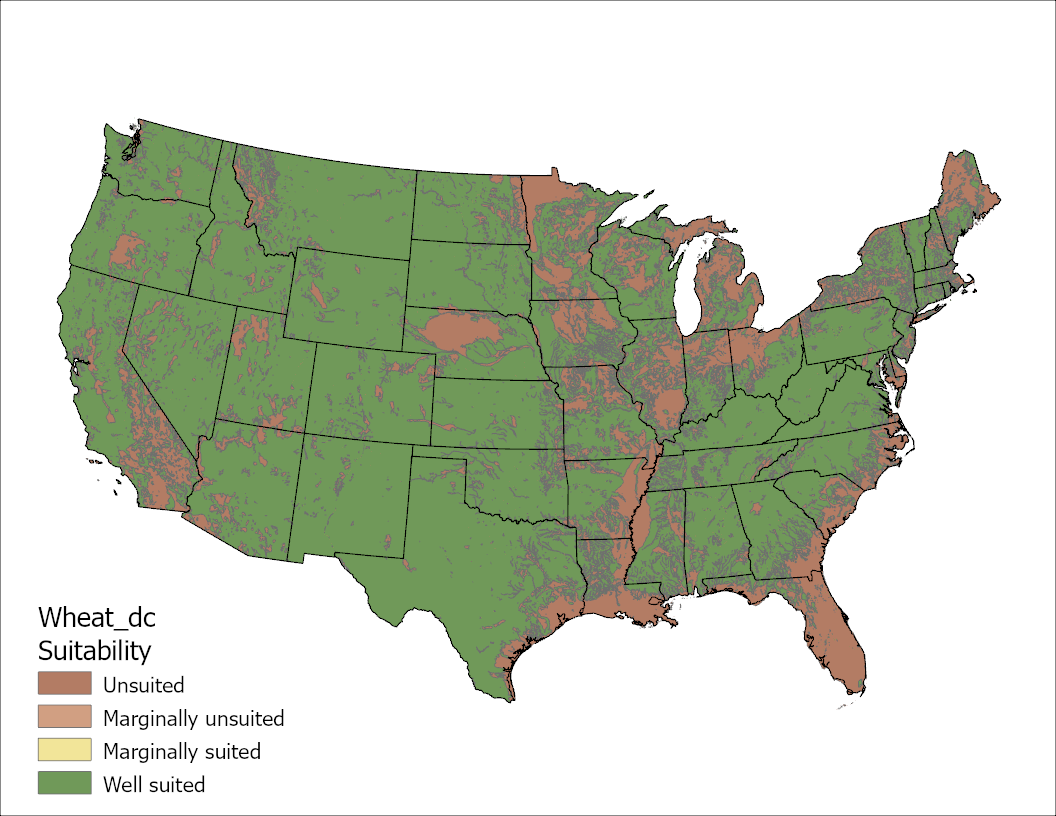
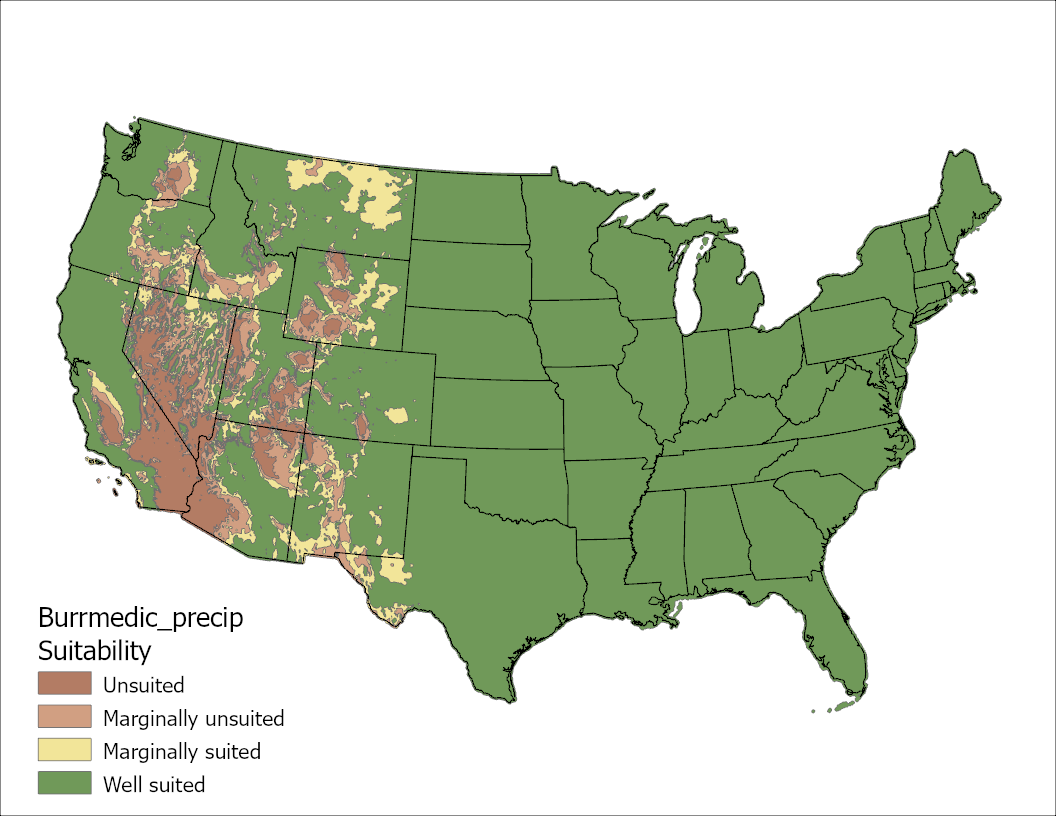
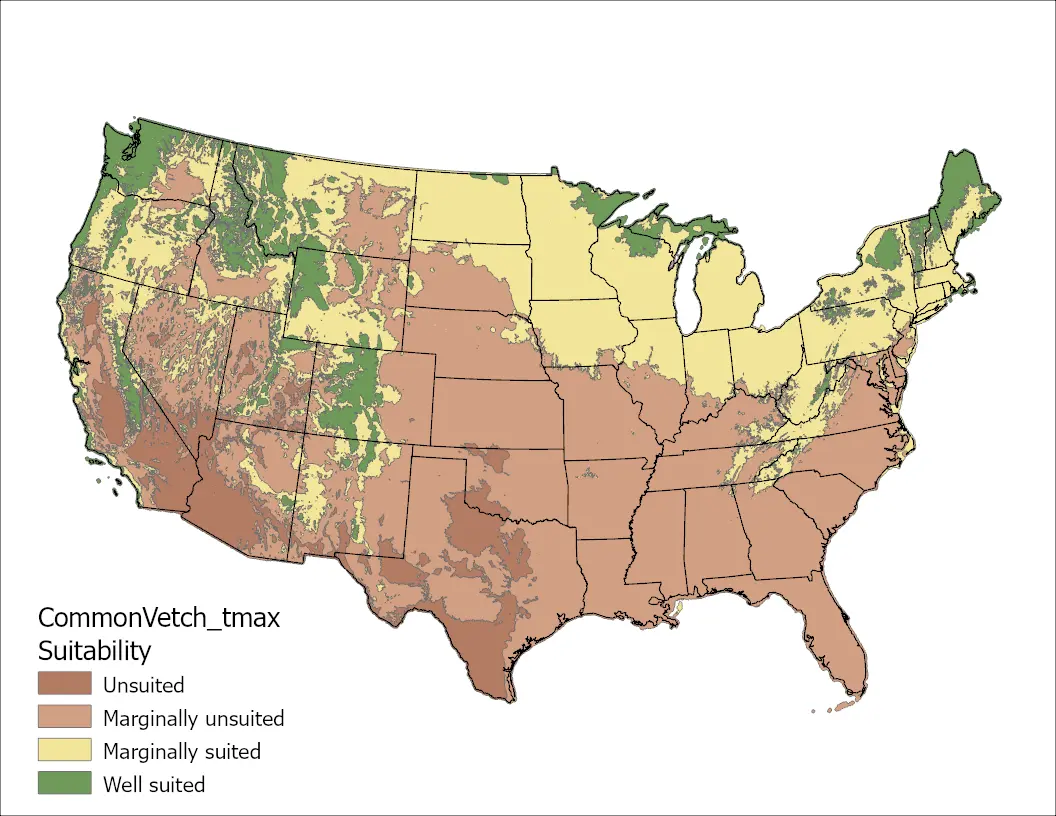
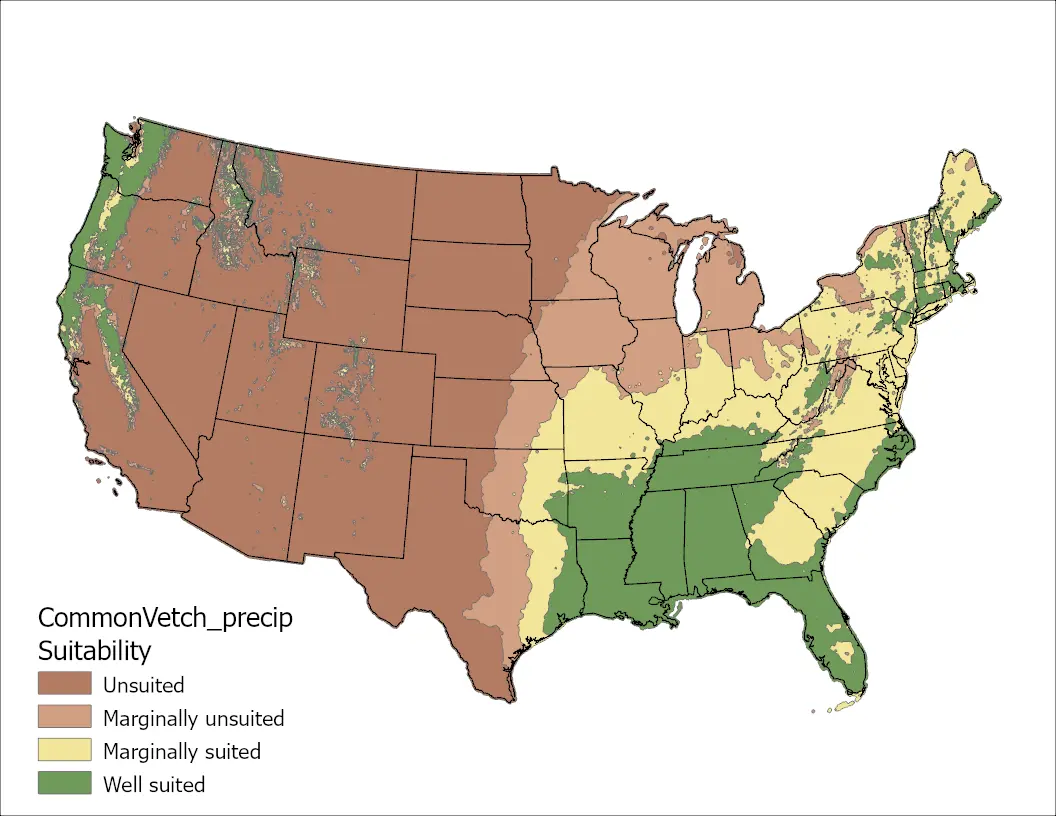
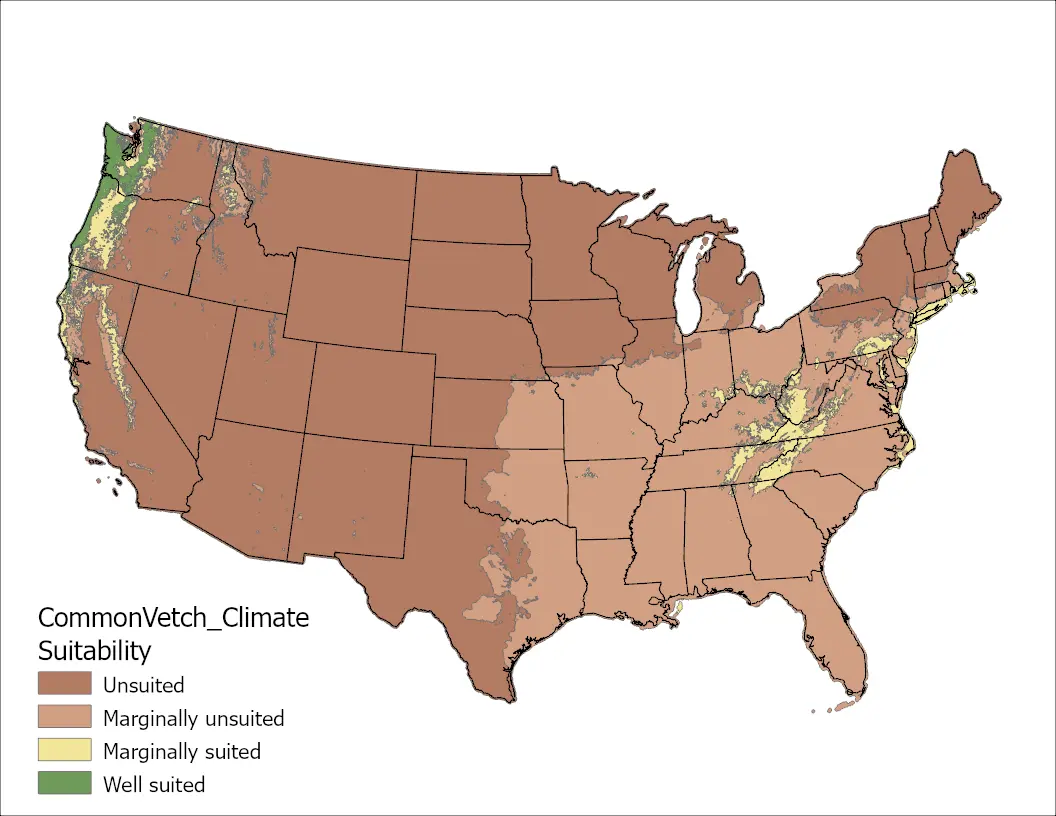
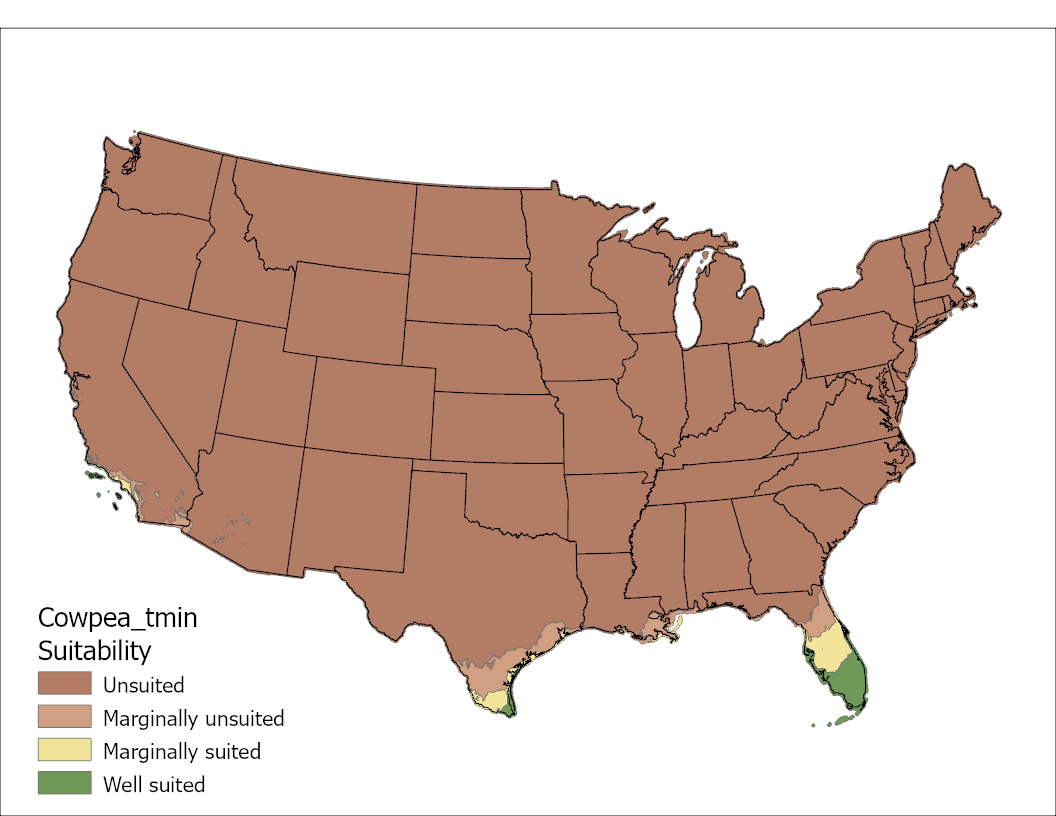
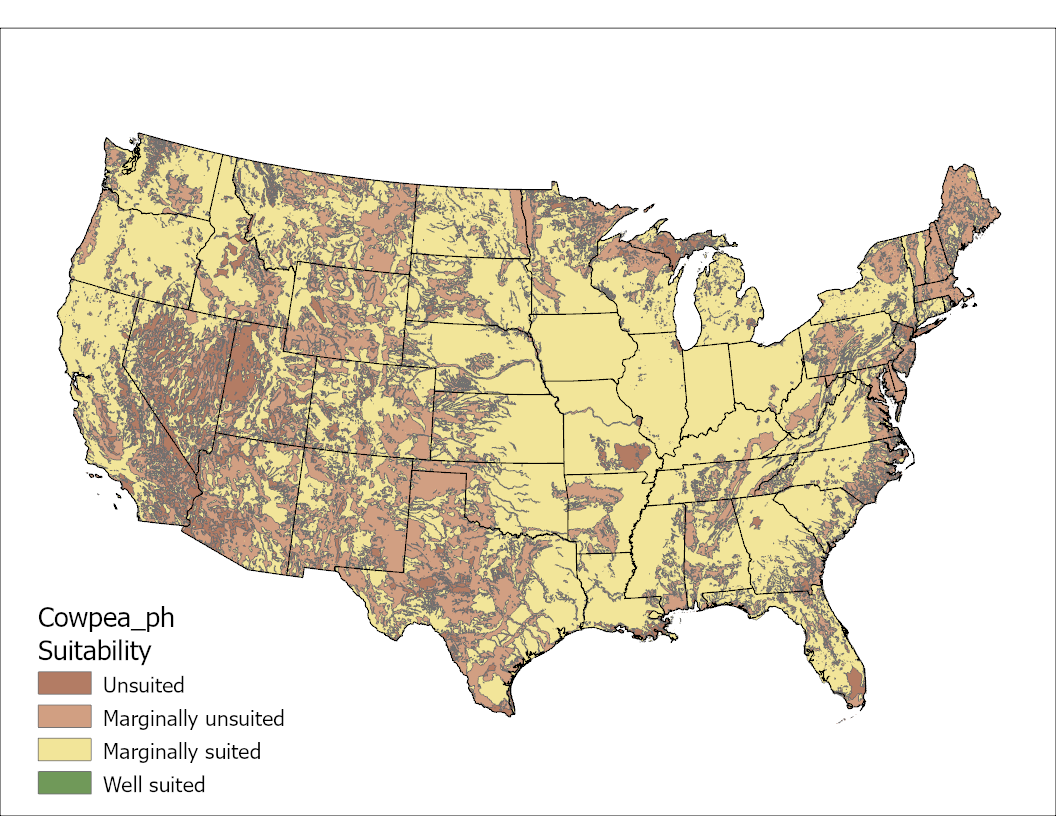
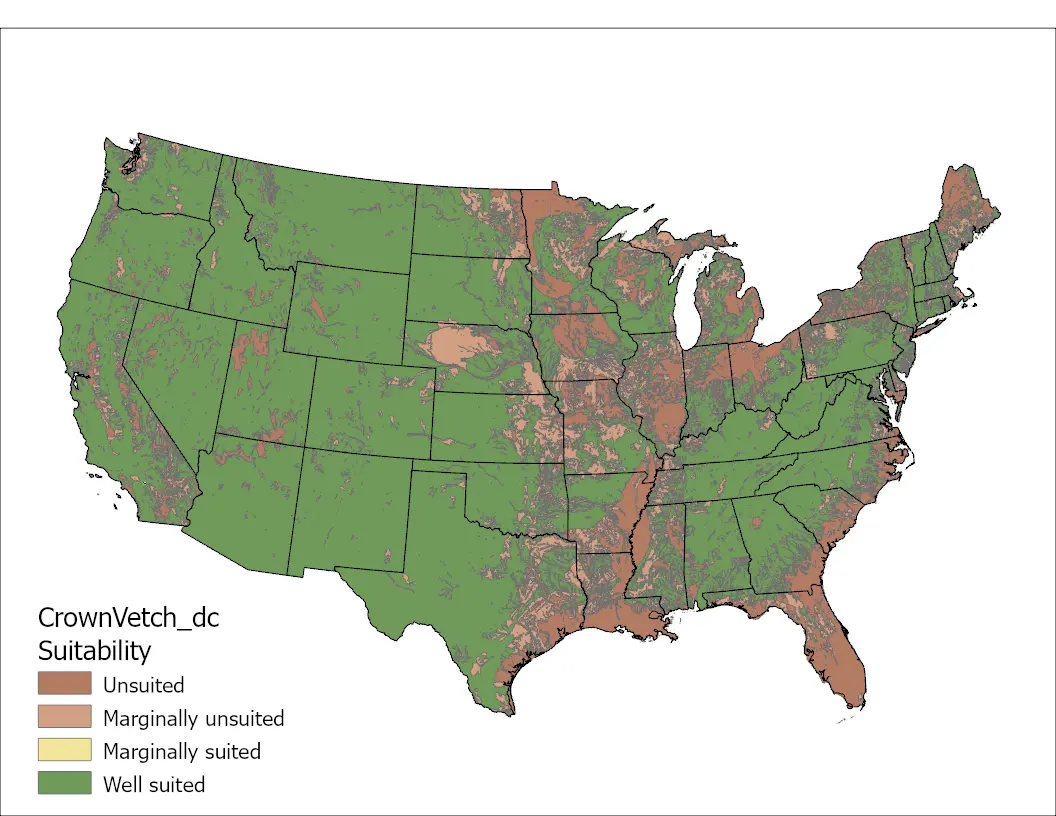
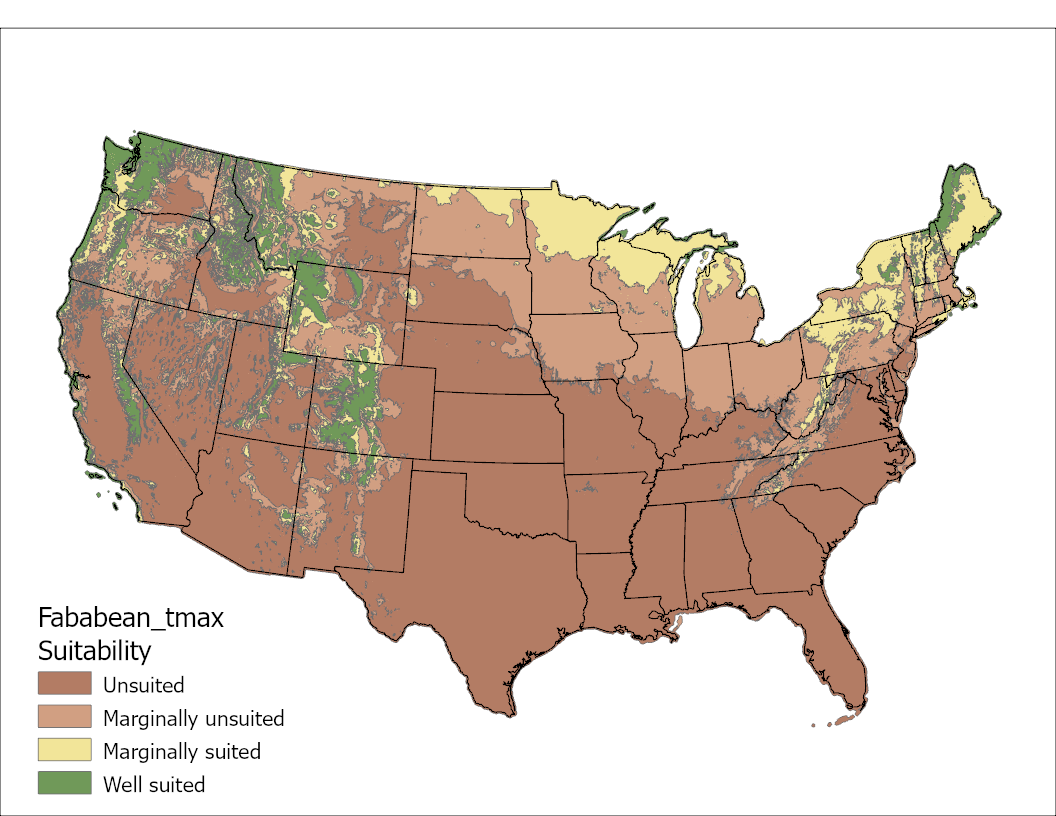
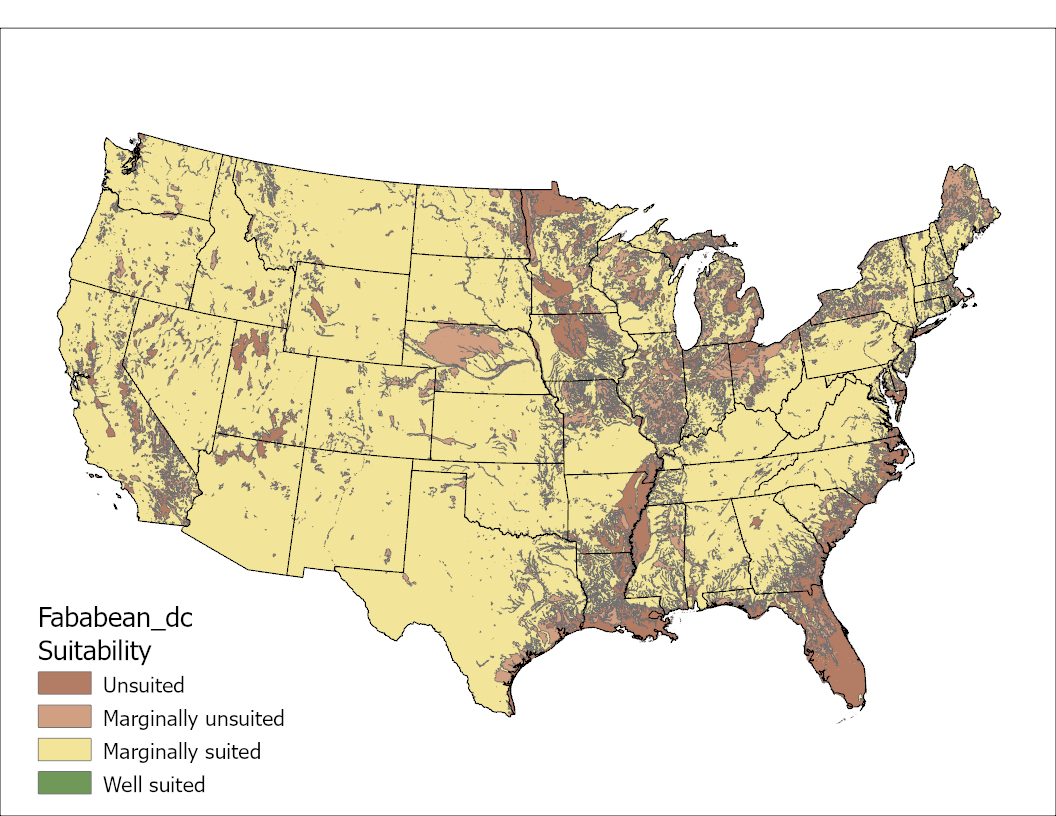
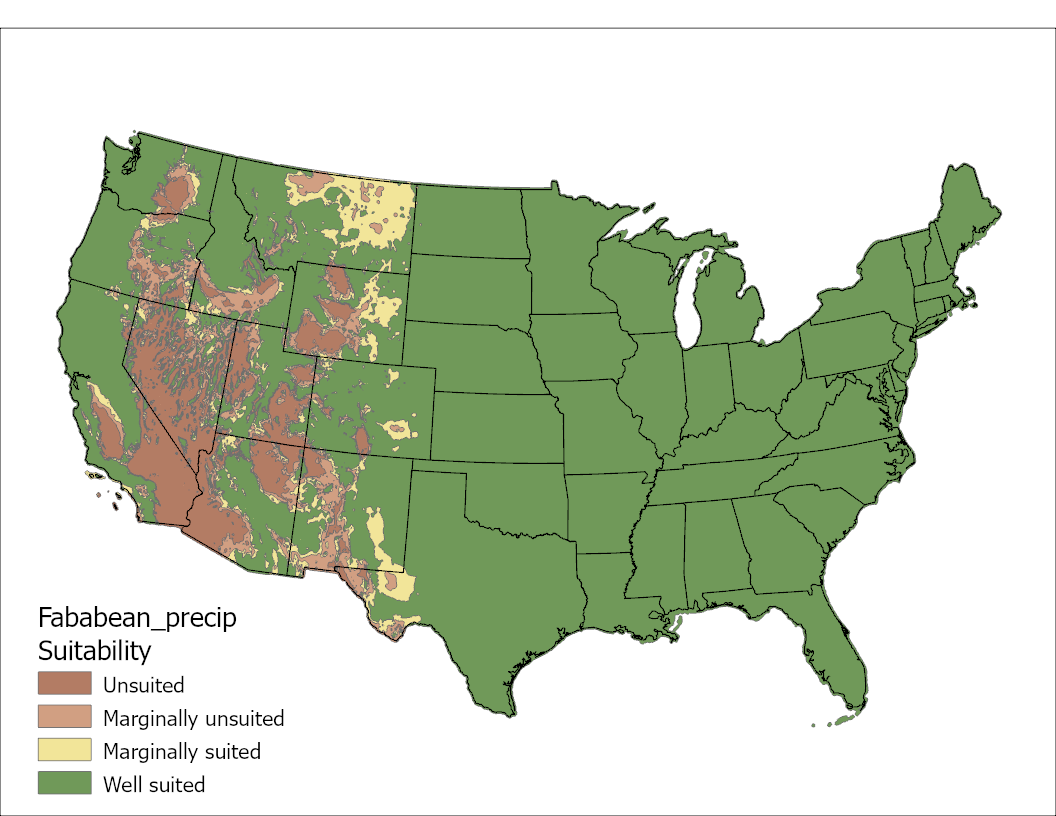
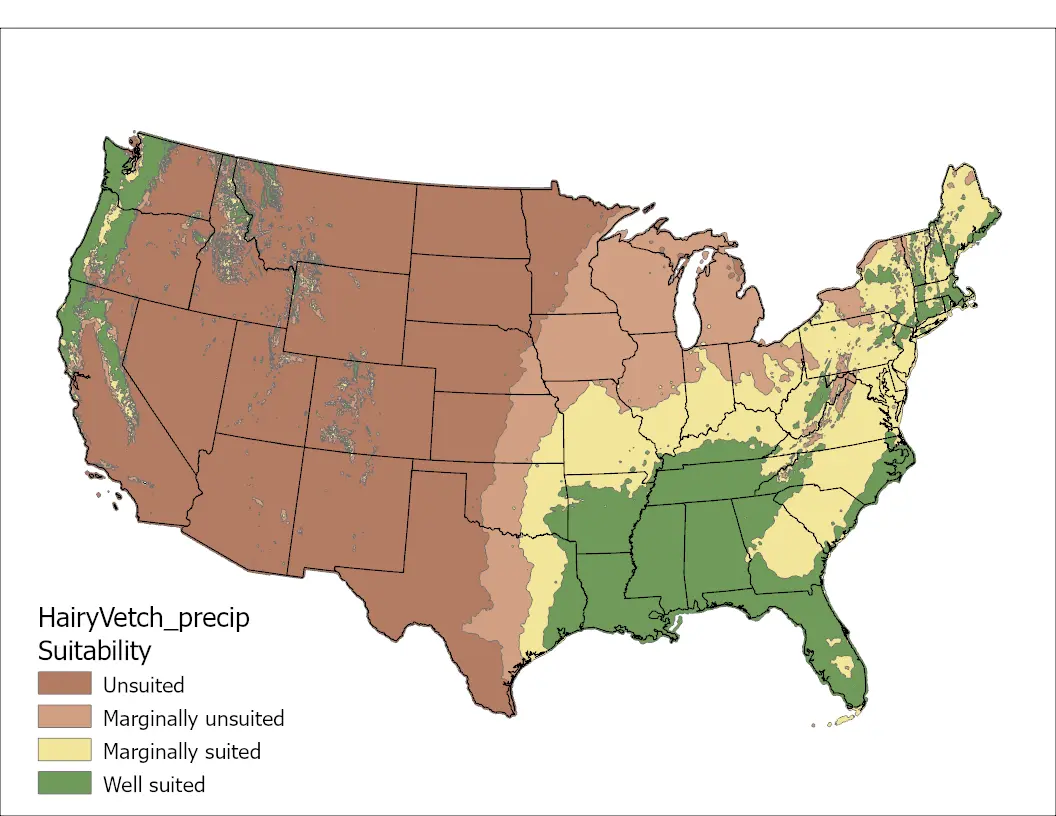
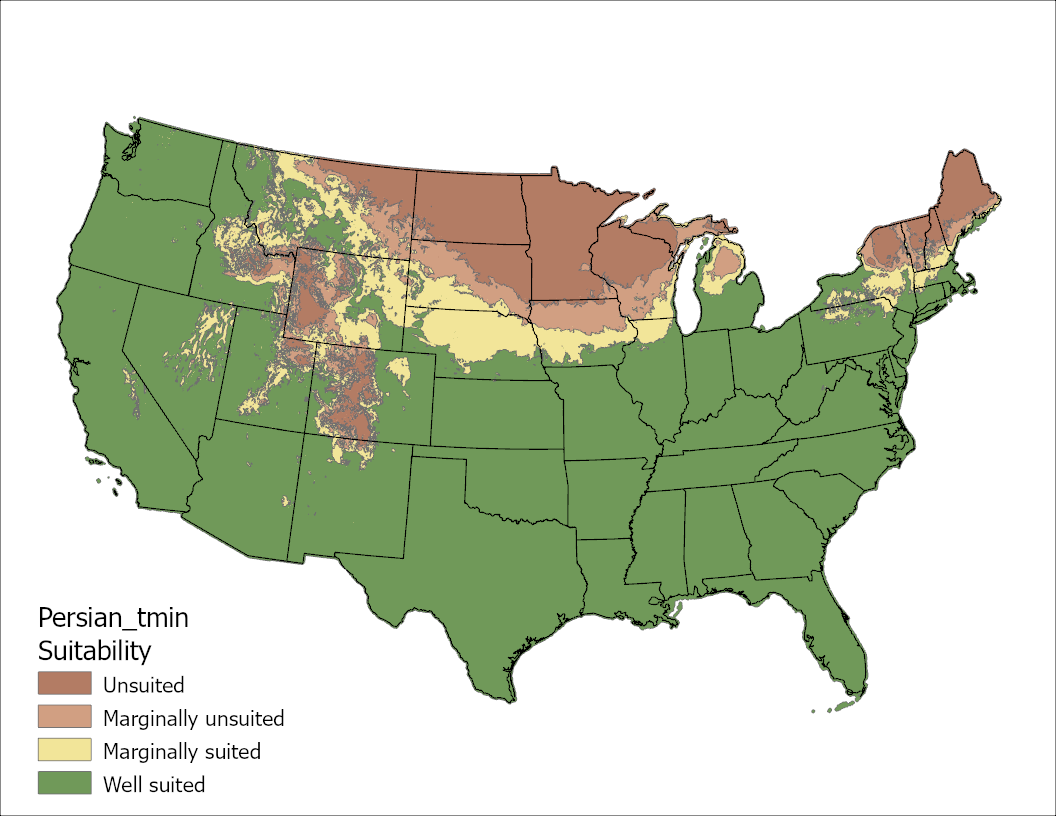
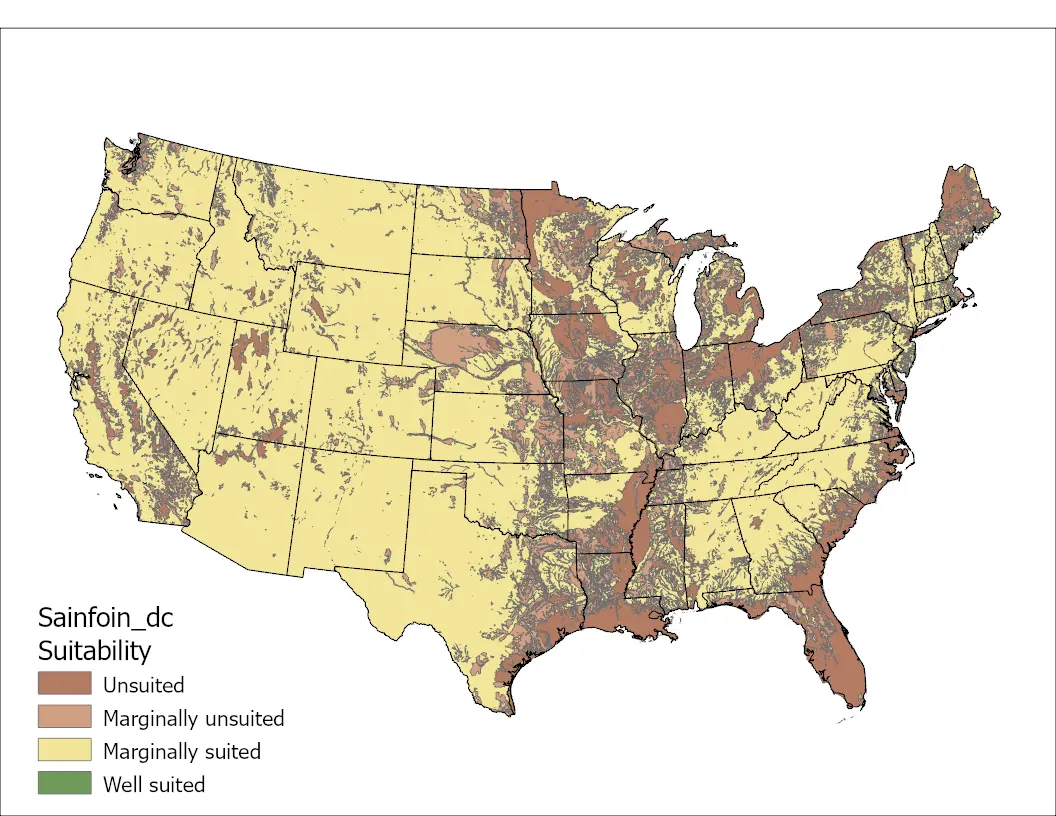
GIS-based suitability zones were divided into four suitability zones, based on their climatic and soil tolerances. An arbitrary classification system based on 25% differences in relative yield (RY) was used:
| Classification | Relative Yield (RY) % |
|---|---|
| Unsuited | 0-25 |
| Marginally unsuited | 26-50 |
| Marginally suited | 51-74 |
| Well suited | 75-100 |
Nine maps were created for winter barley, one for each of 3 climate factors and one for each of the soil factors, one combined climate factors map, one combine soil factors map, and a map for all of the factors combined. This allows for each factor to be examined and addressed to improve suitability through management. Small images of maps are provided below, with larger maps linked by clicking.
QUANTITATIVE TOLERANCES GIS-BASED MAPS
The contiguous USA
| Climate Factors | Soil Factors | Combined Factors |
|---|---|---|
|
Minimum Temperature Image
|
pH Image

|
Climate and Soil Image

|
|
Maximum Temperature Image

|
Drainage Image

|
Soil Image

|
|
Precipitation Image

|
Salinity Image

|
Climate Image

|


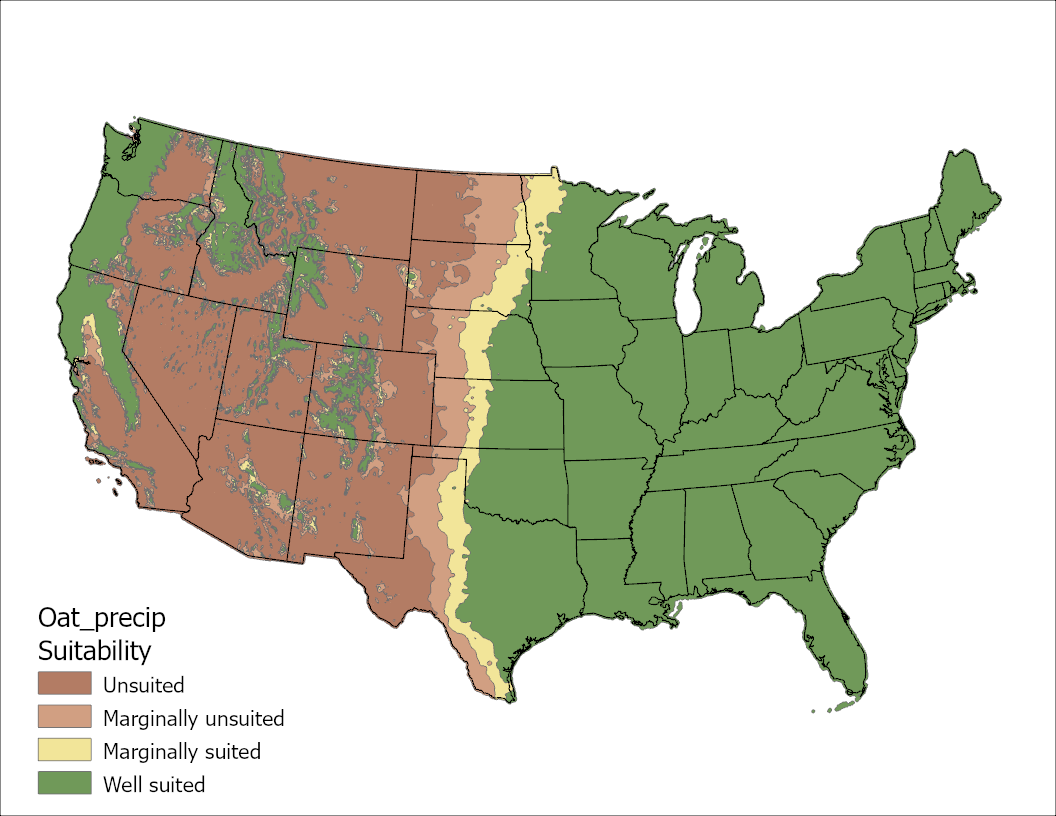
Based on literature and expert oat specialist counsel, climatic and soil tolerances were compiled. Nine maps were created for oat, one for each of 3 climate factors and one for each of the soil factors, one combined climate factors map, one combined soil factors map, and a map for all of the factors combined. This allows for each factor to be examined and addressed to improve suitability through management. Small images of maps are provided below, with larger maps linked by clicking. For spring oat, all factors except for Tmin values would be the same.
The Contiguous USA
|
Climate Factors |
Soil Factors | All Factors Combined |
|---|---|---|
|
Minimum Temperature Image
|
pH Image

|
Climate and Soil Image

|
|
Maximum Temperature Image

|
Drainage Image

|
All Soil Image
|
|
Precipitation Image
|
Salinity Image

|
All Climate Image

|
Click on the thumbnail image to view a larger map.
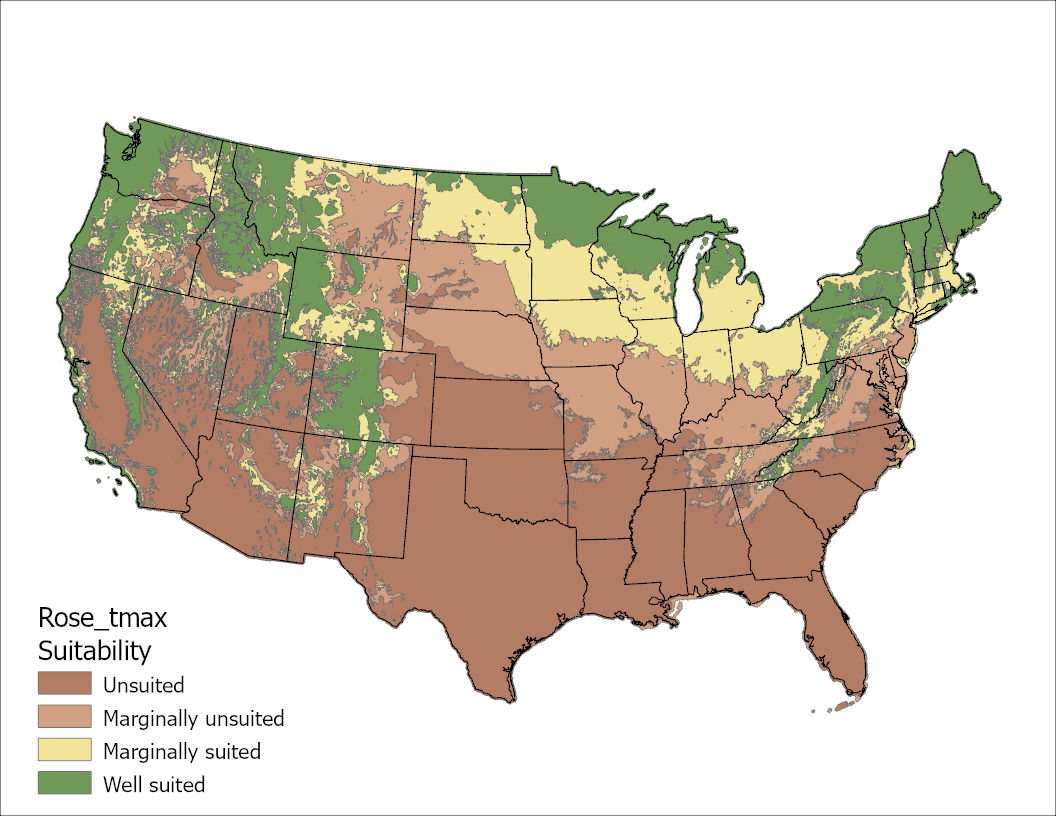
To create highly detailed and accurate species suitability maps it was necessary to change from a qualitative description of plant characteristics to an approach that defines tolerances quantitatively. Tolerances to climatic and soil factors were defined (Table 1) and used to map suitability based on summary publications (Moser et al., 1996) and expert knowledge of forage scientists.
Moser, L.E, D.R. Buxton, and M.D. Casler, Eds. 1996. Cool Season Forage Grasses. American Society of Agronomy Monograph 34. 841 pp. ASA, CSSA, and SSSA, Madison, WI.
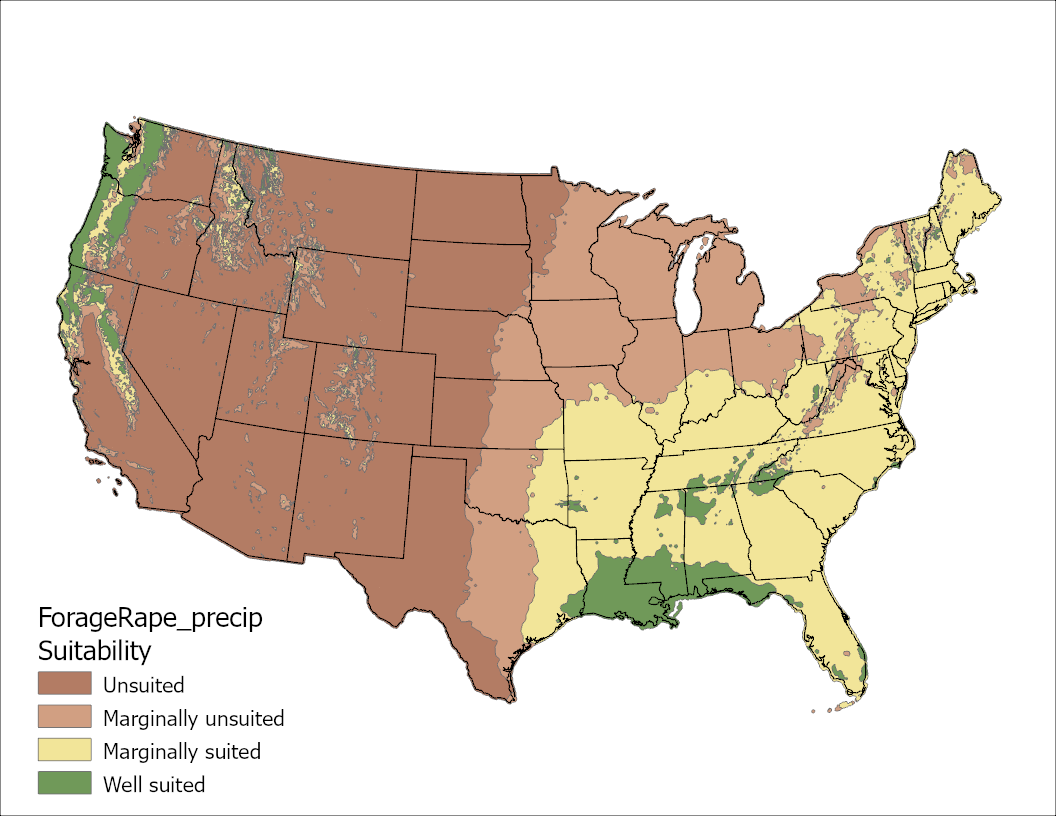
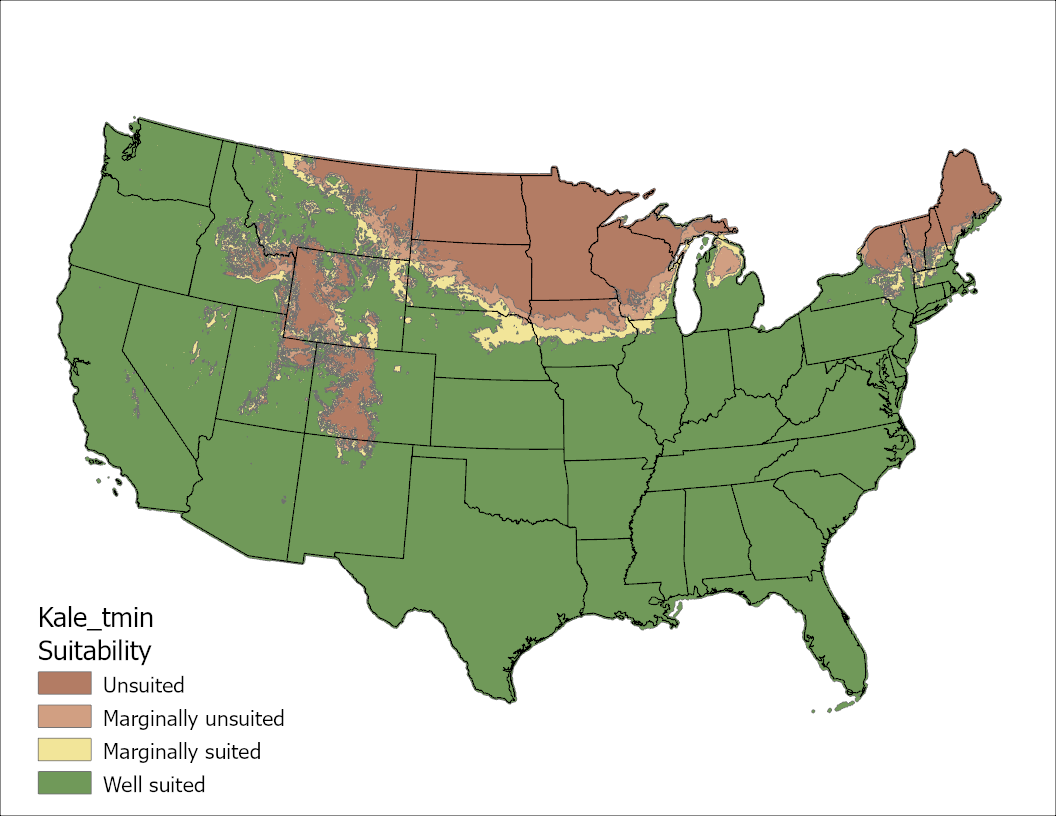
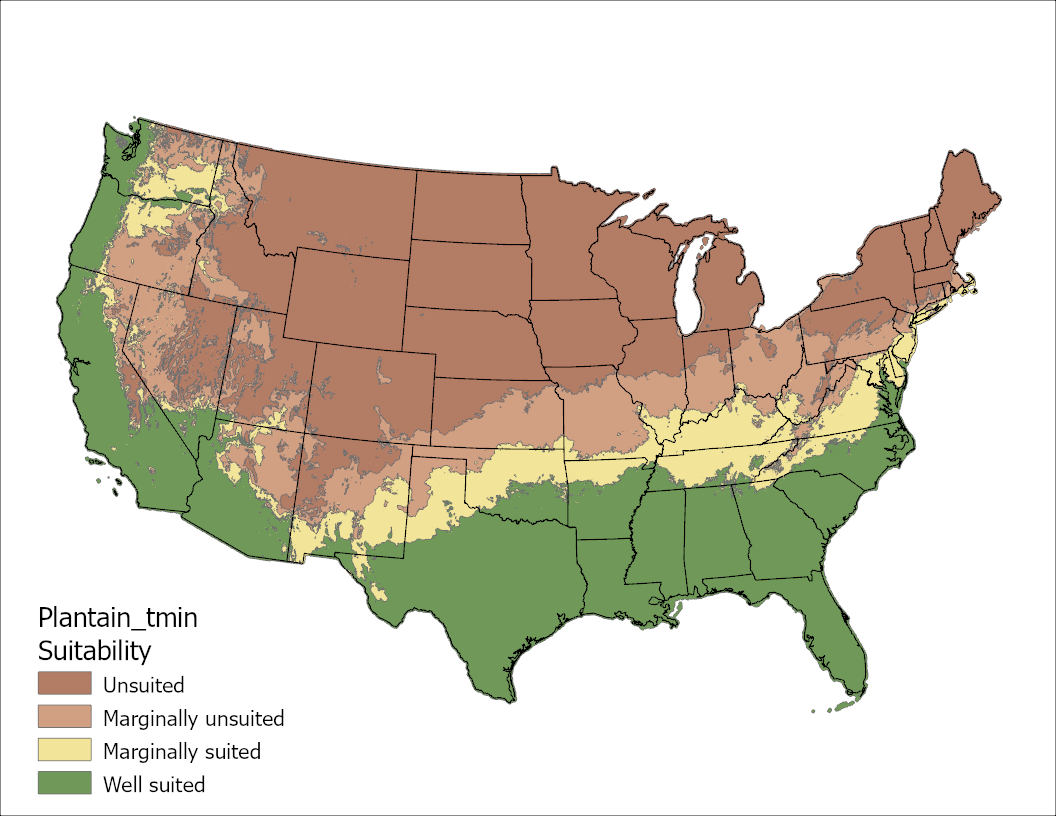
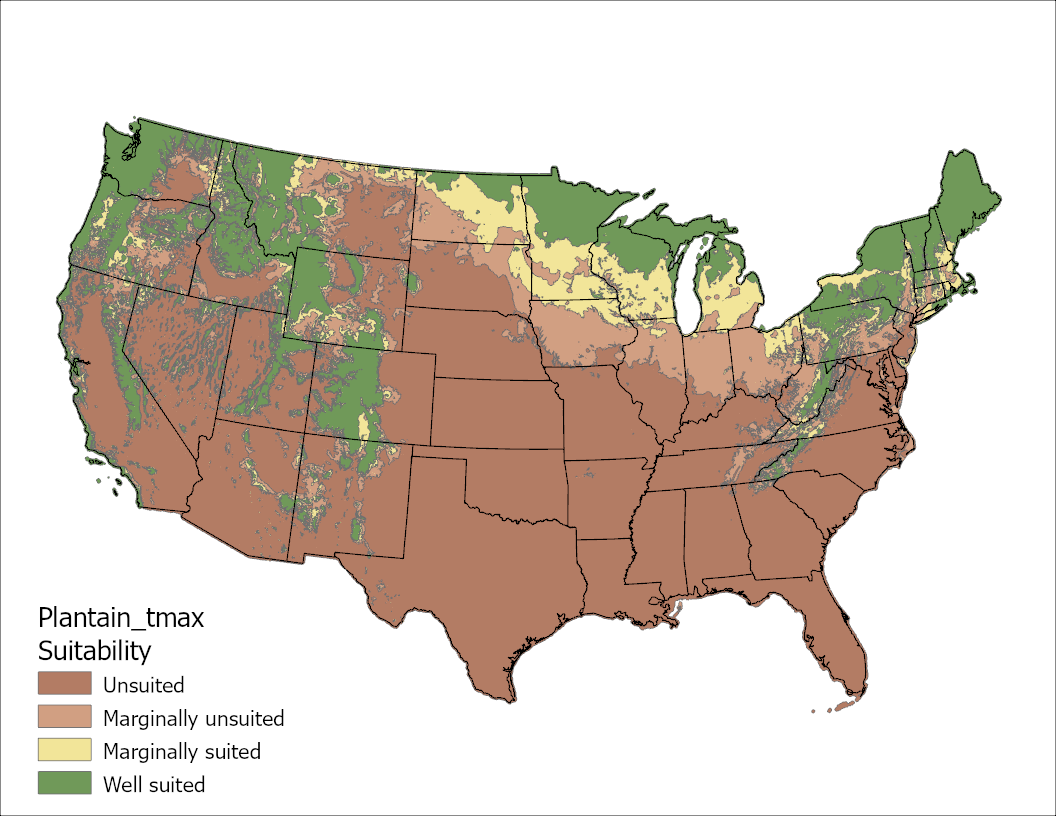
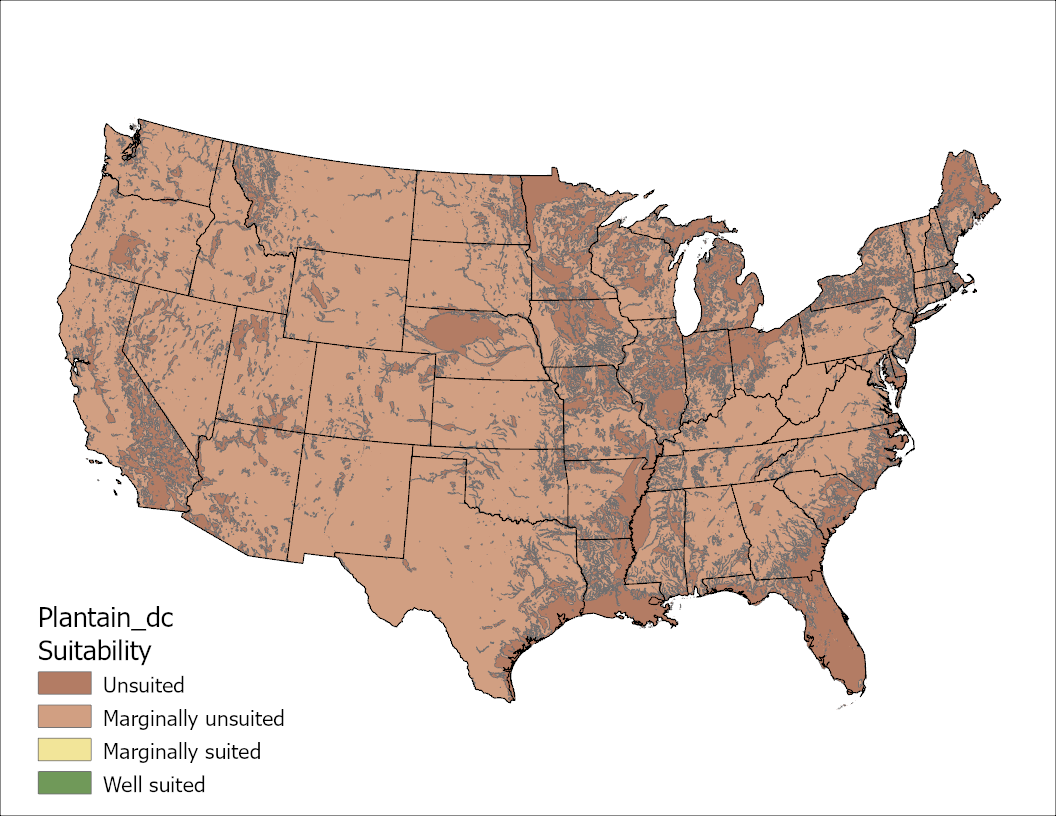
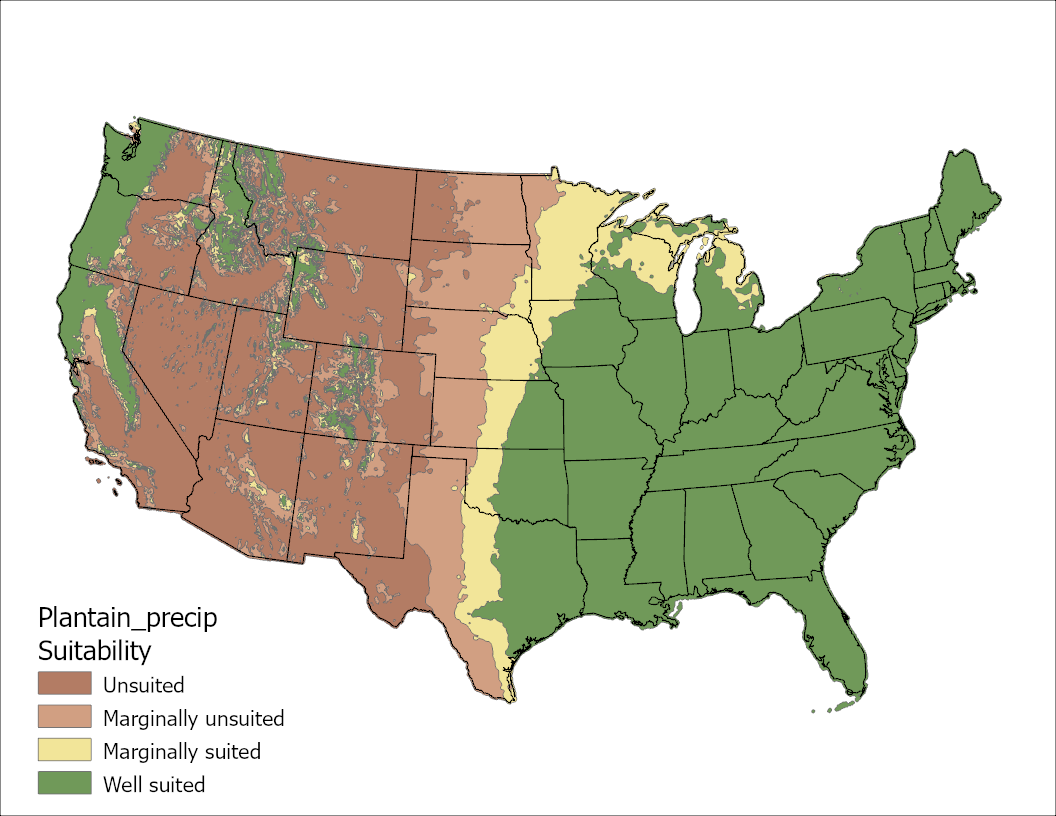
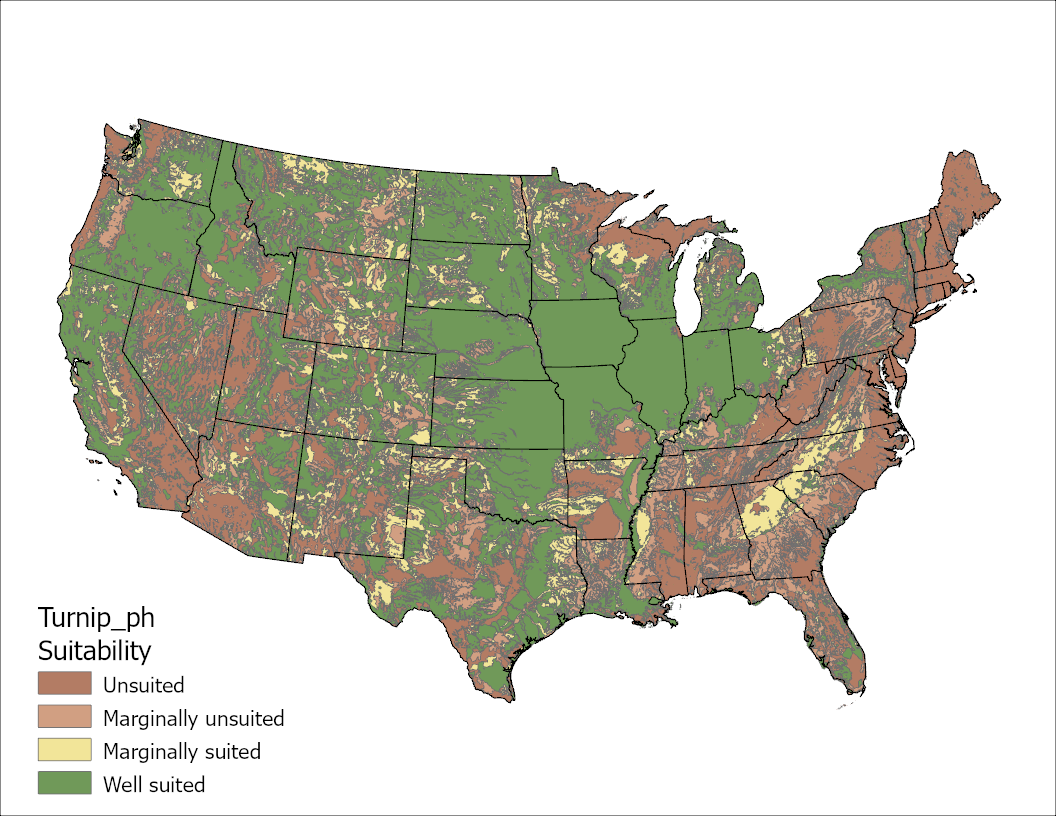
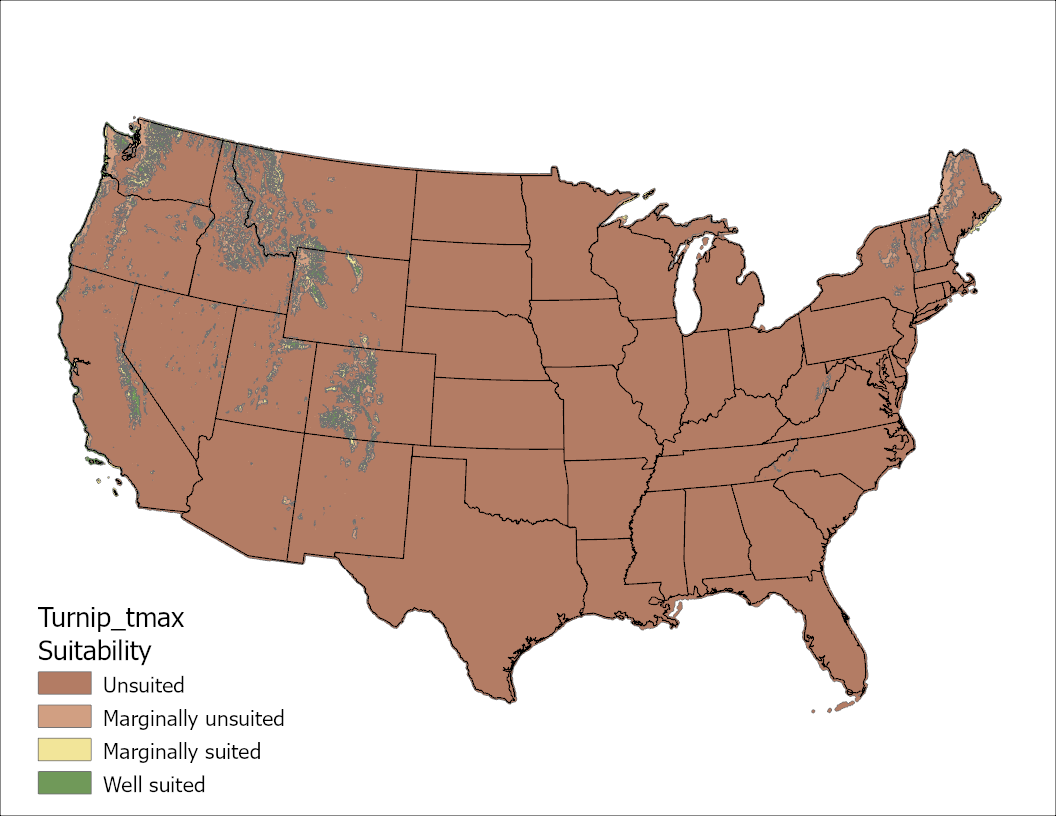
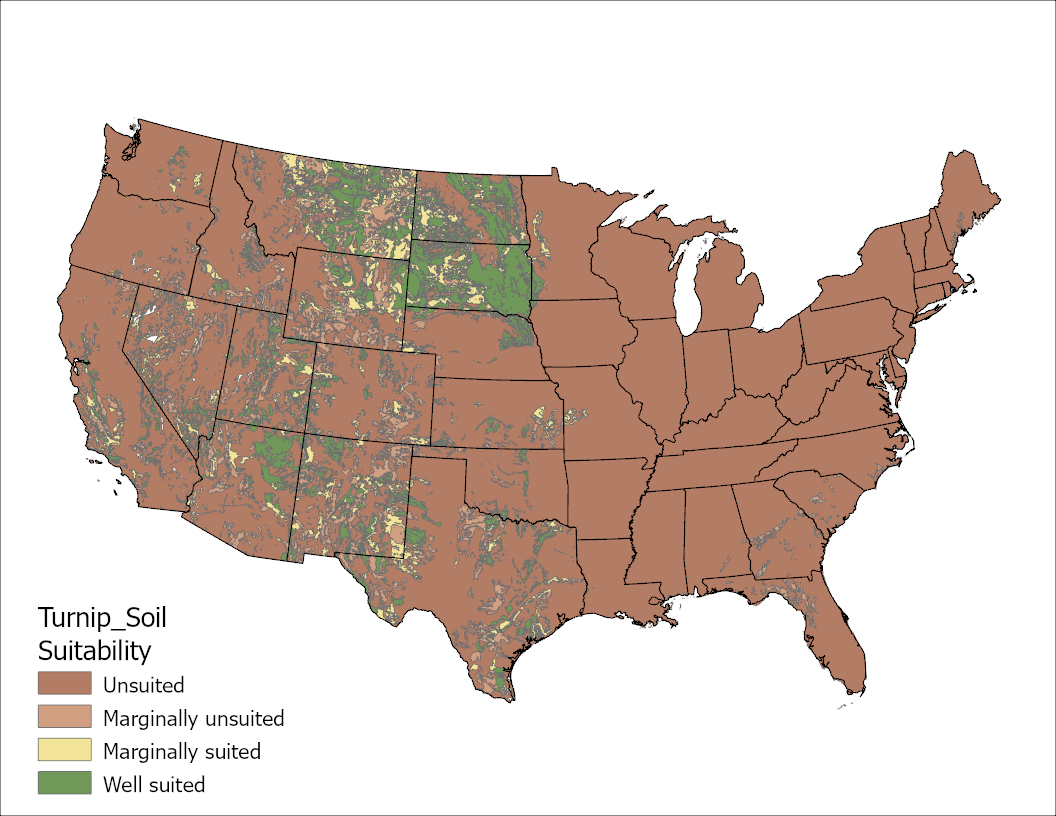
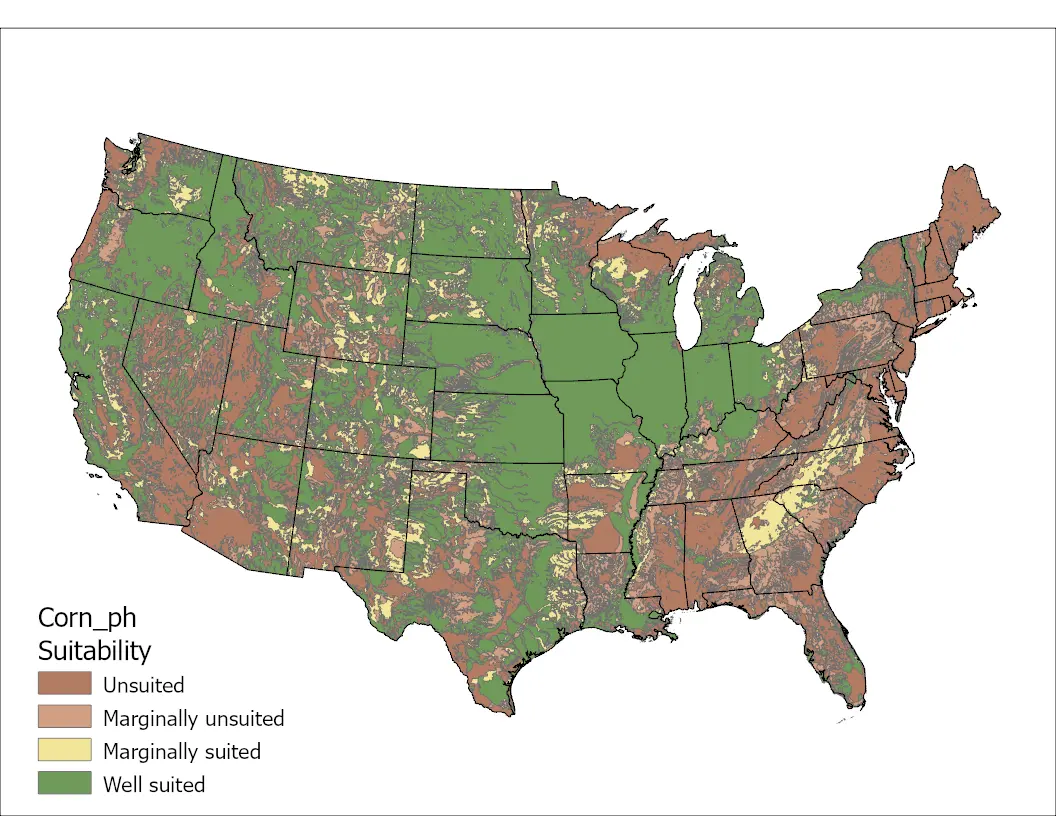
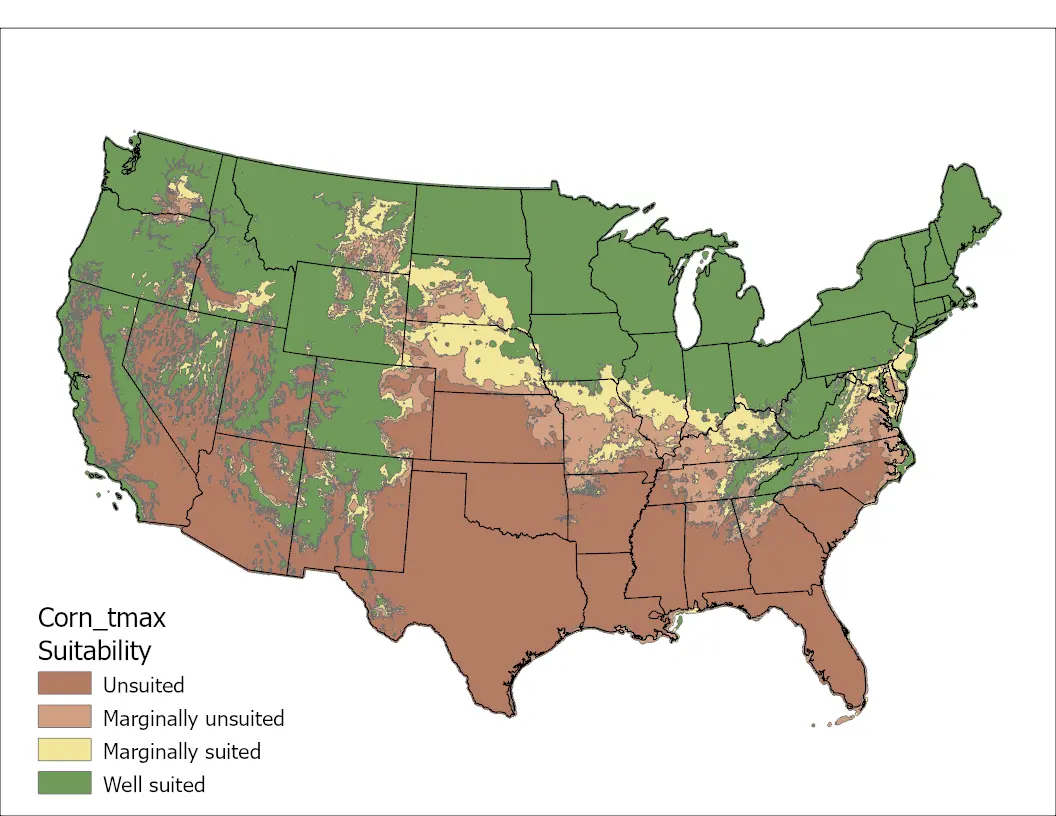
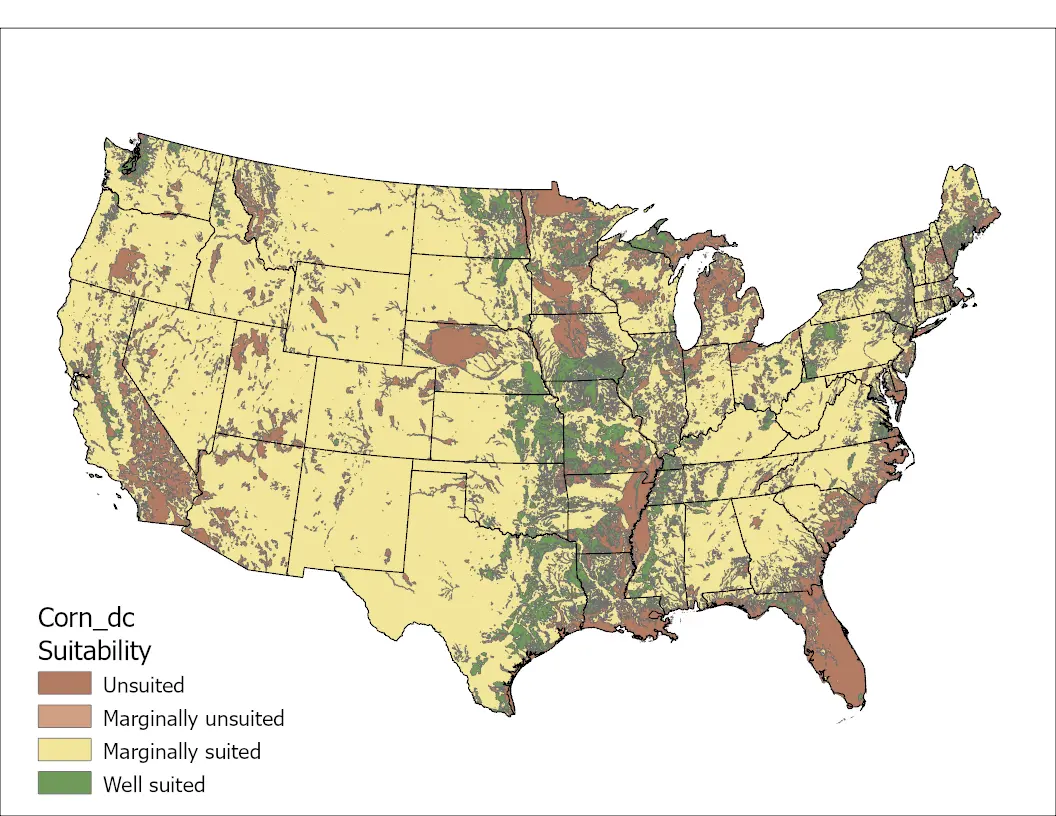
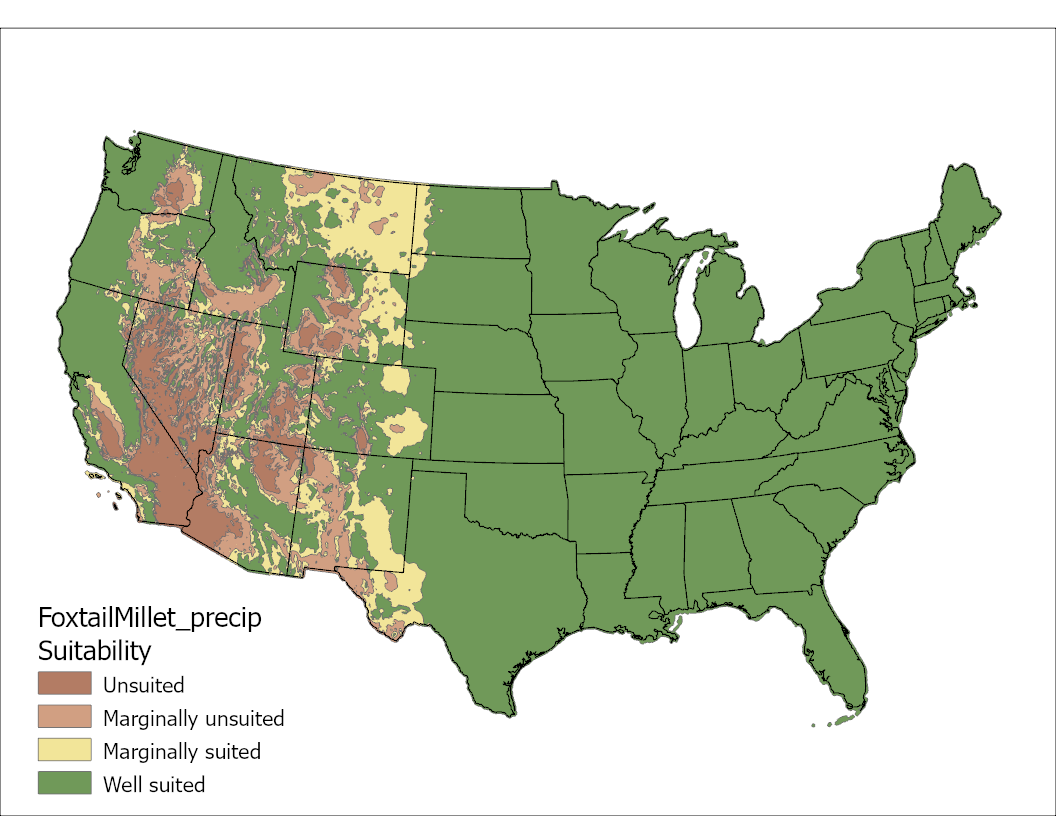
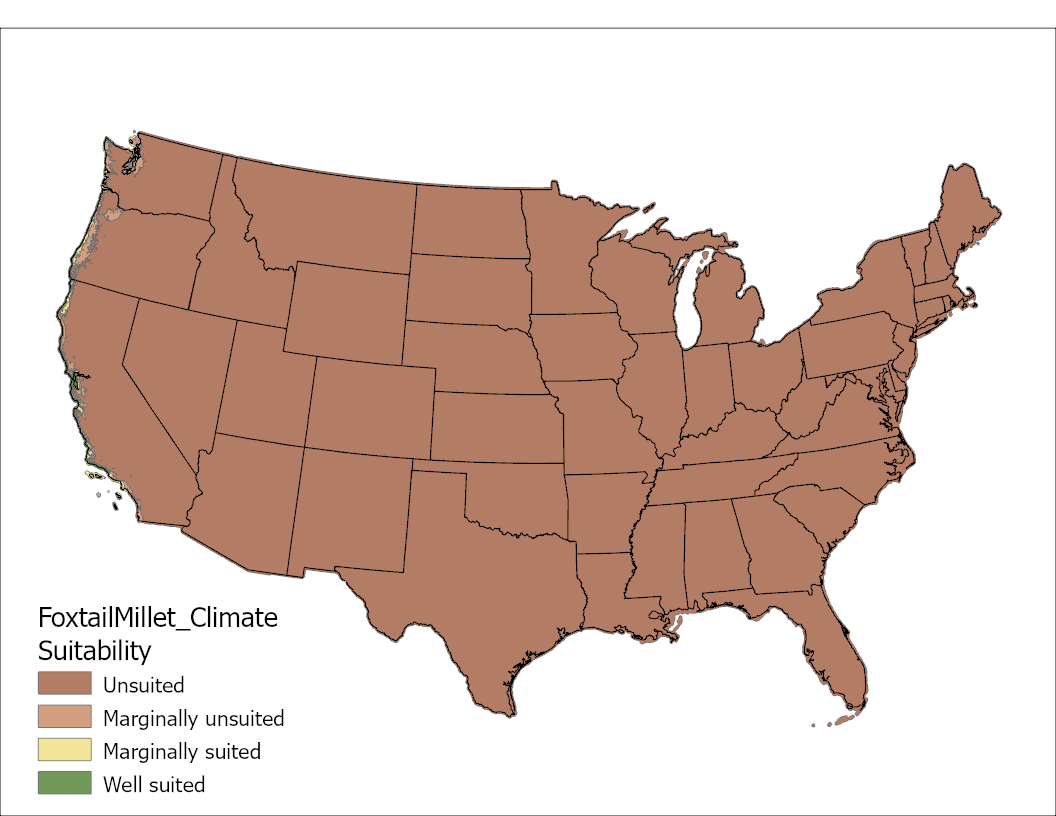
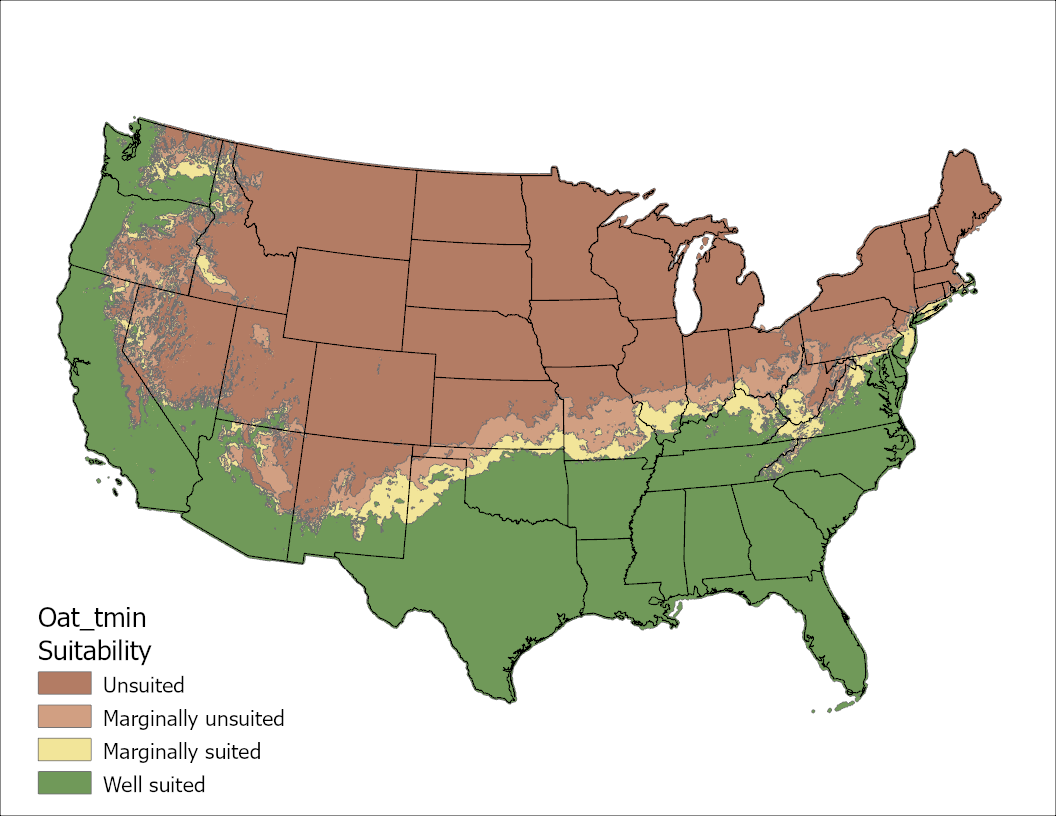
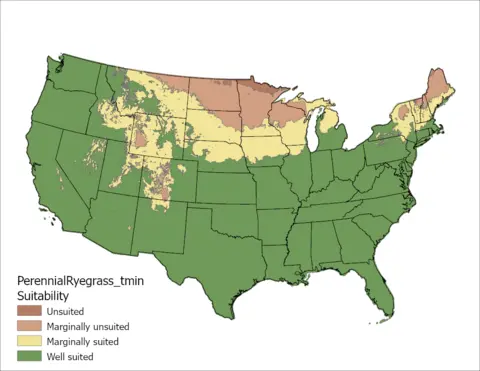
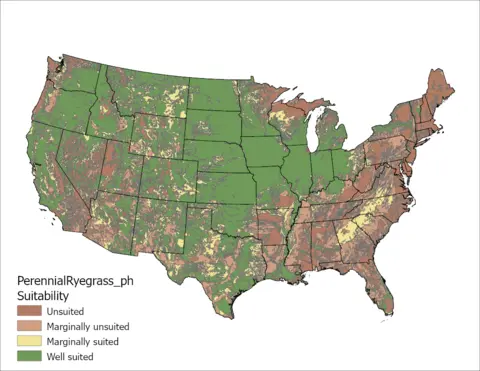
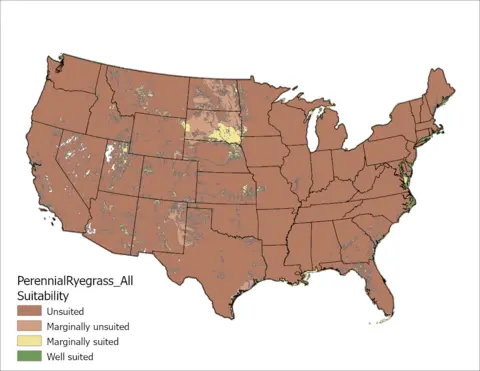
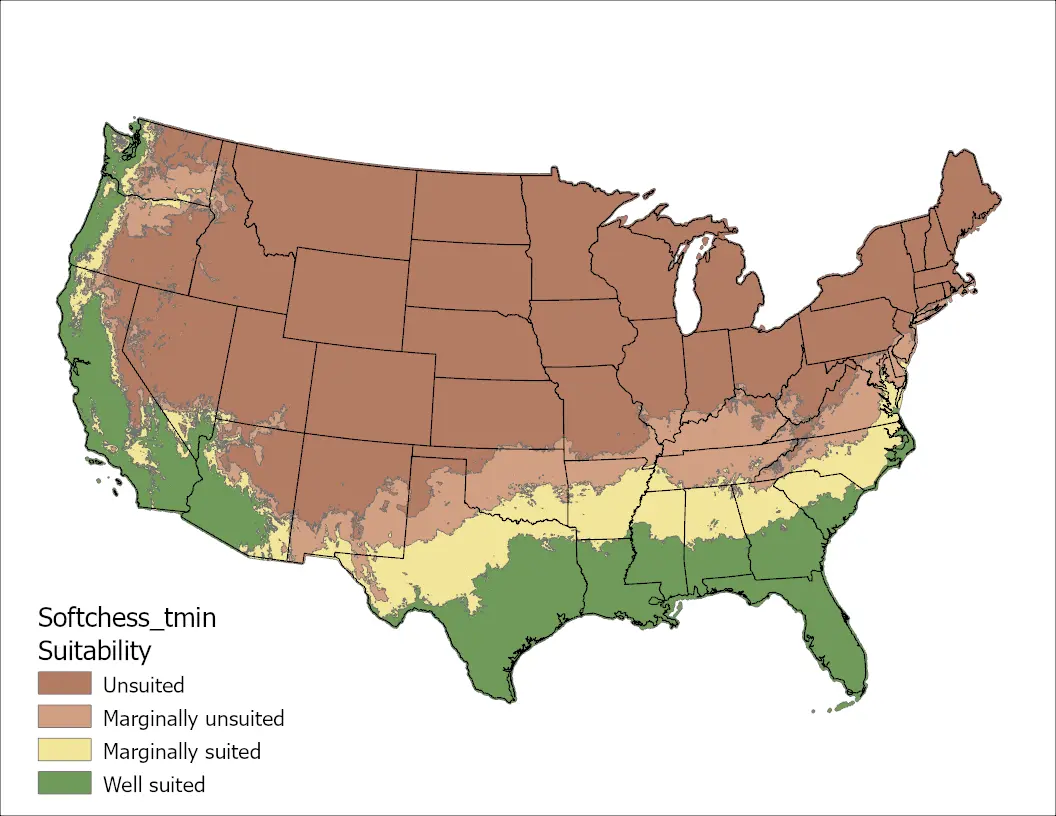
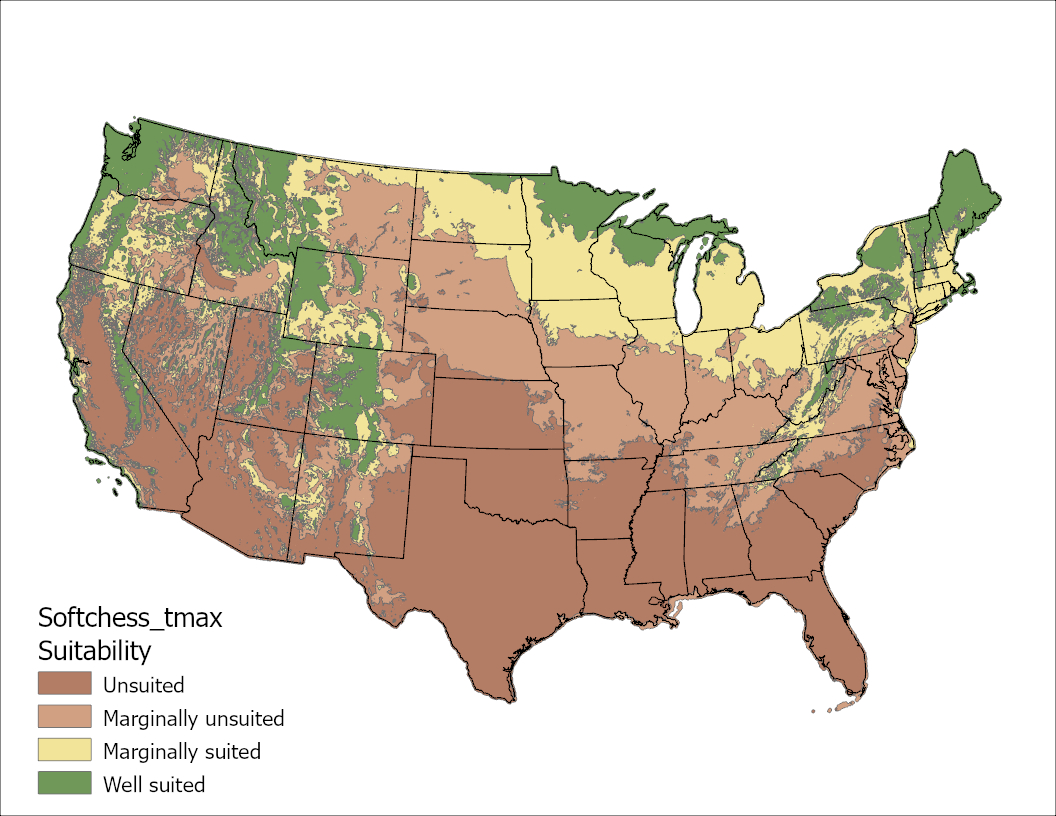
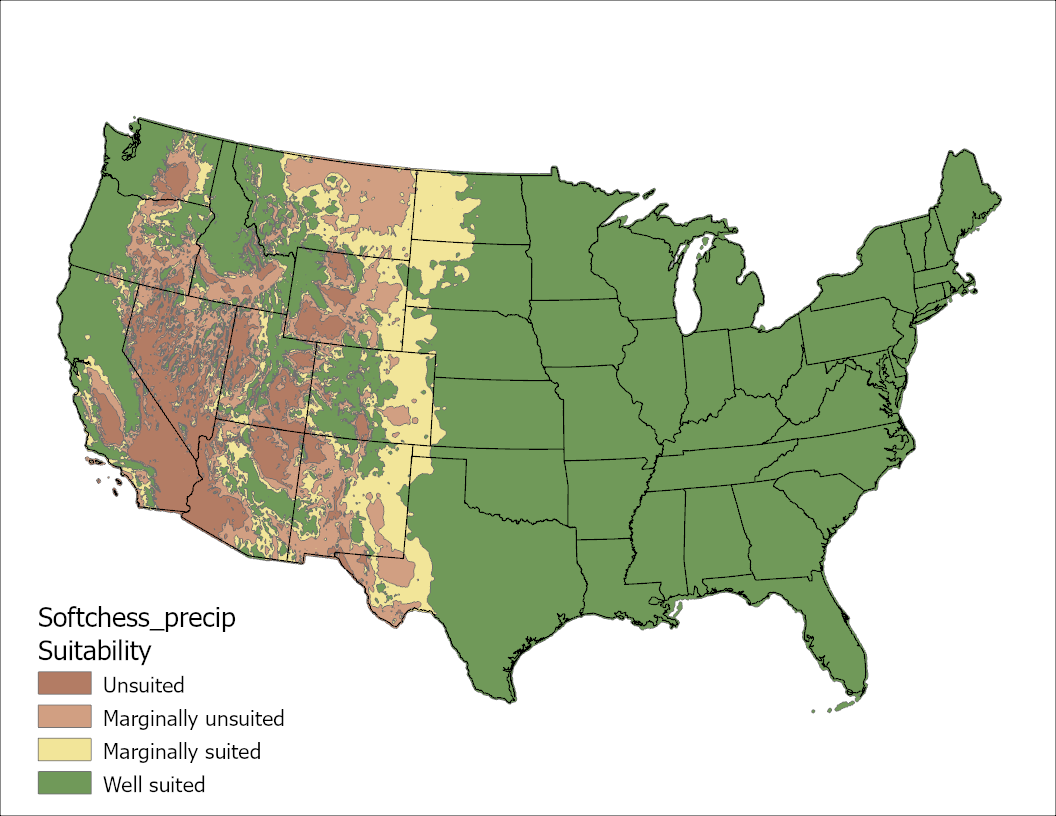
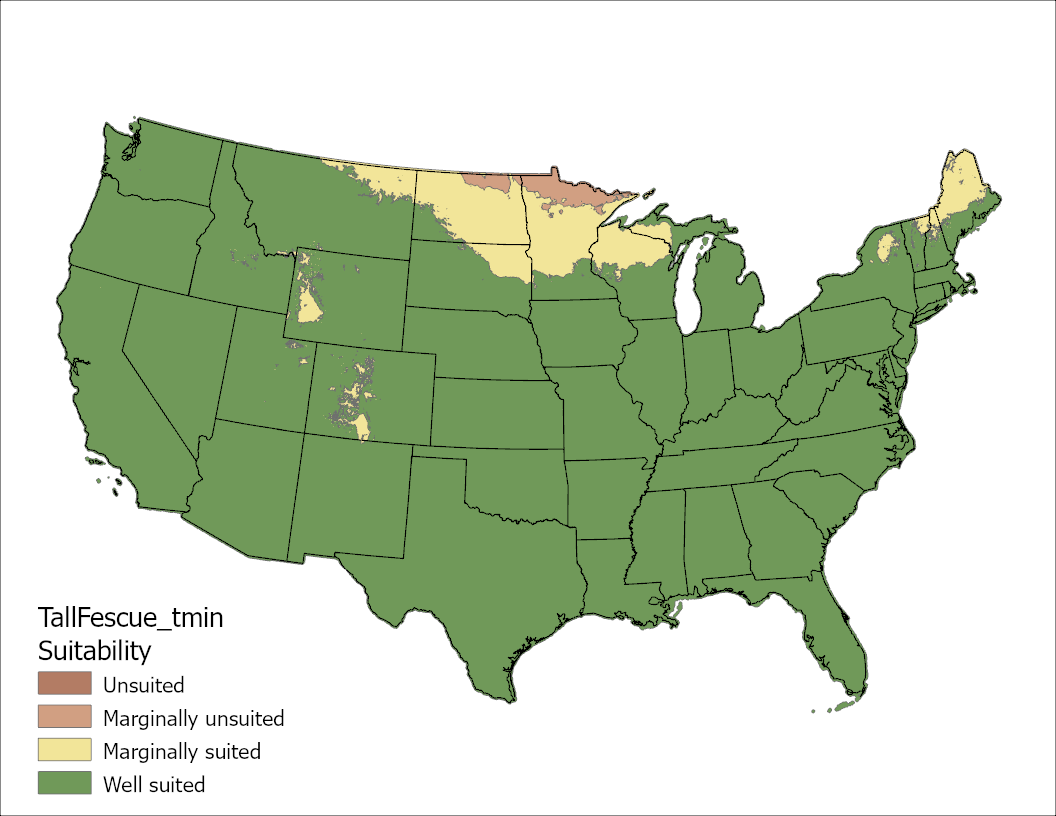
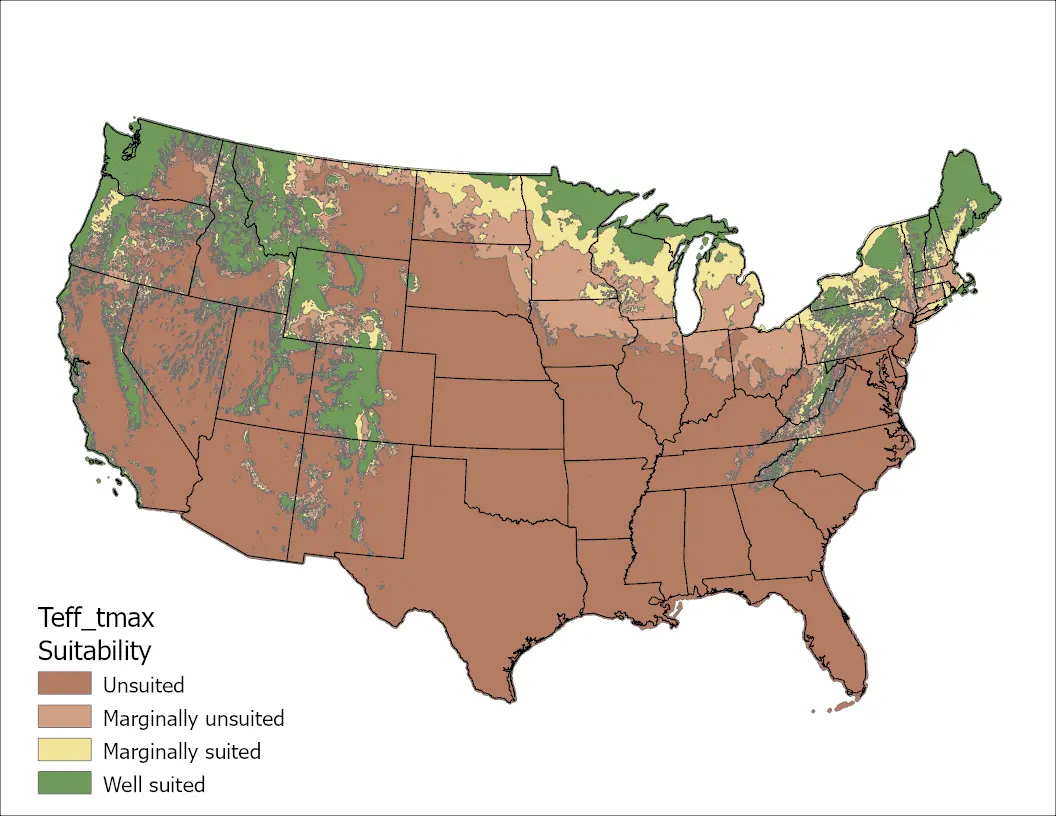
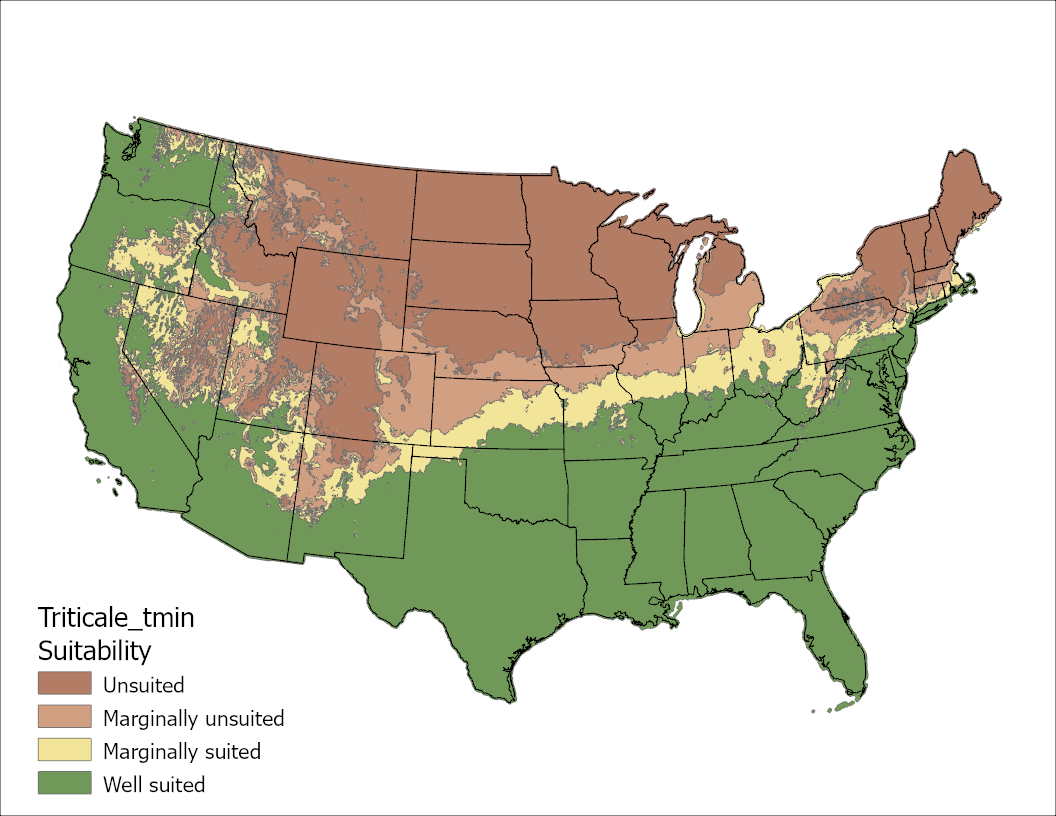
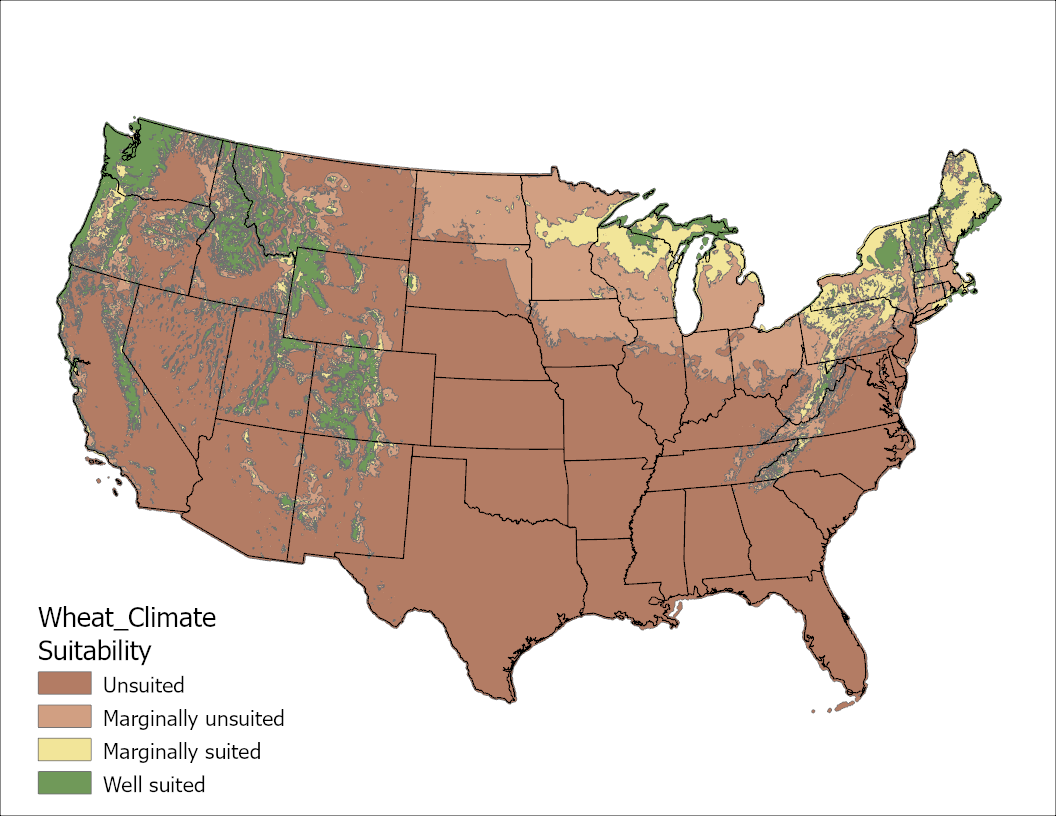
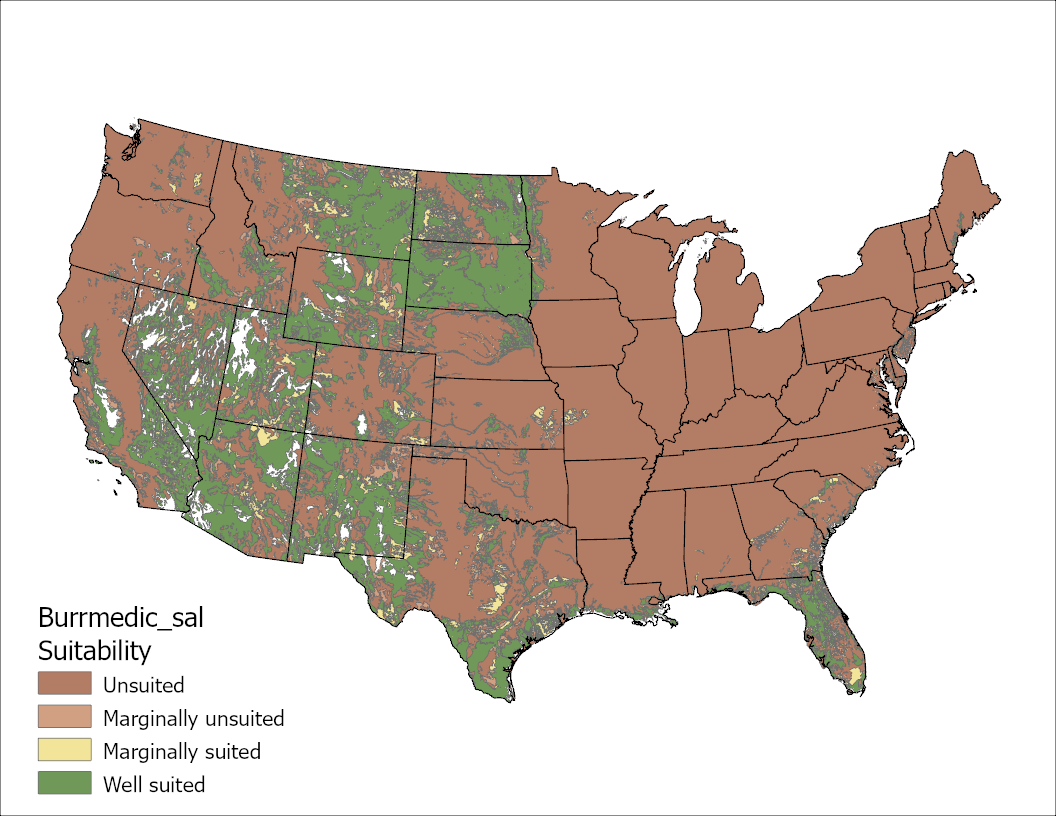
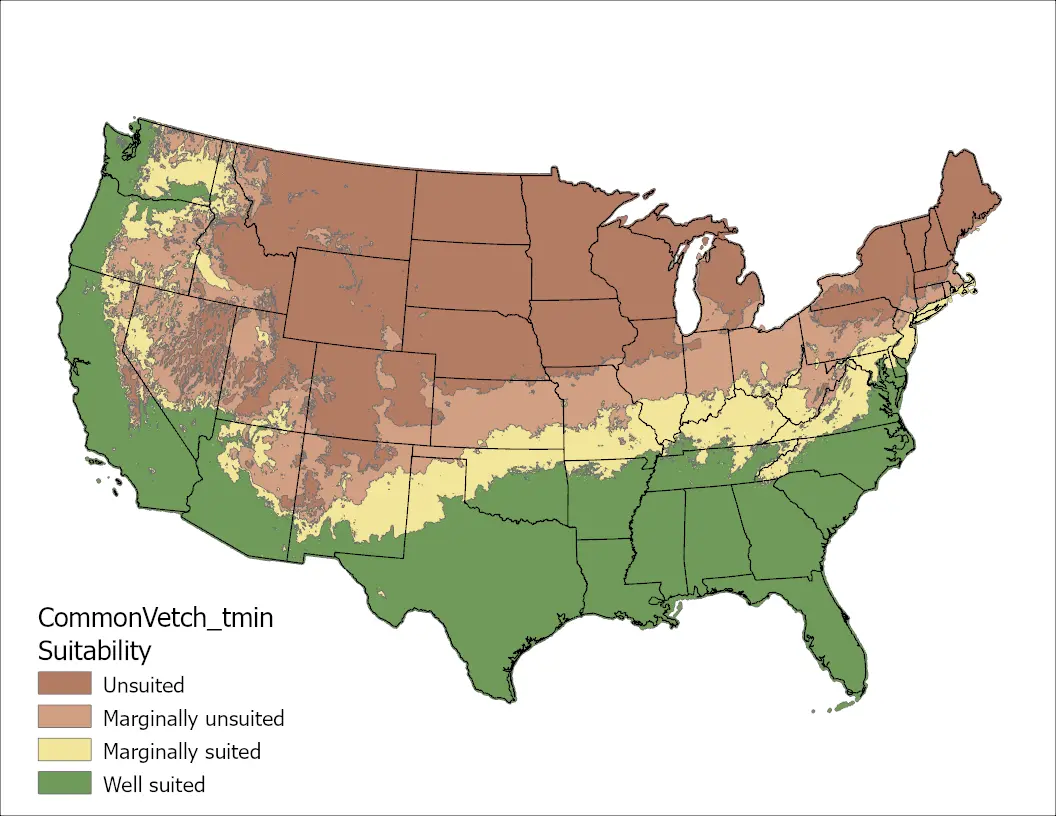
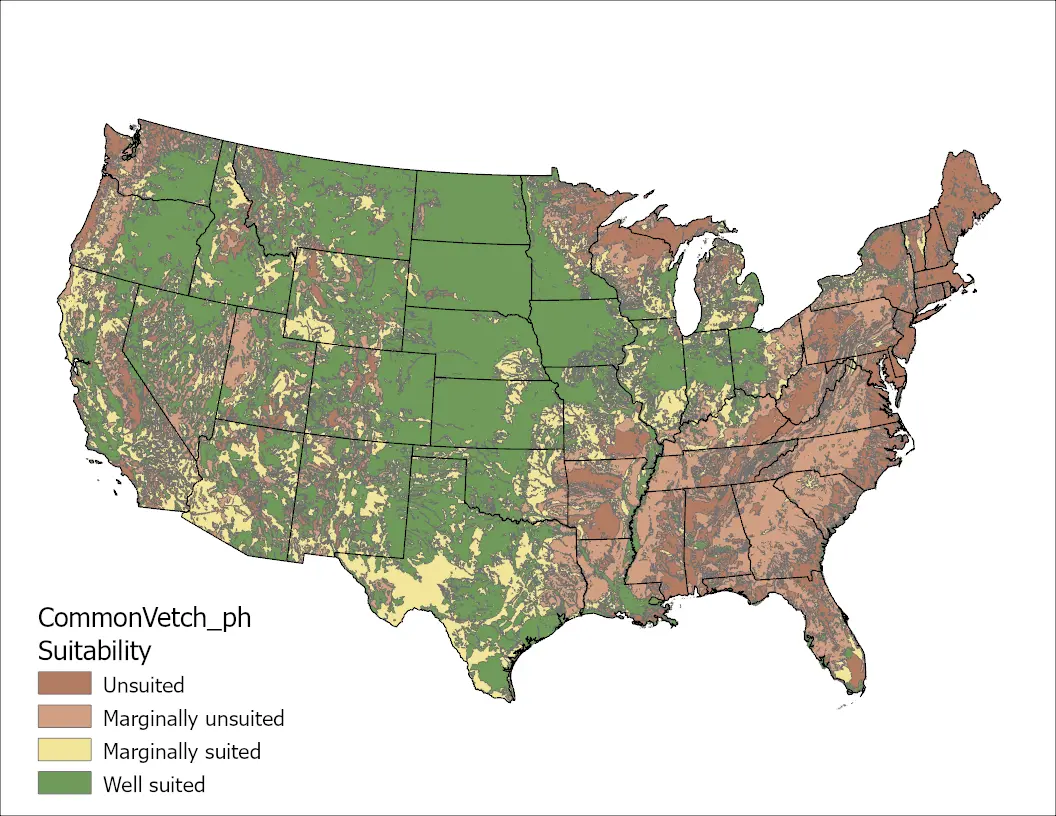
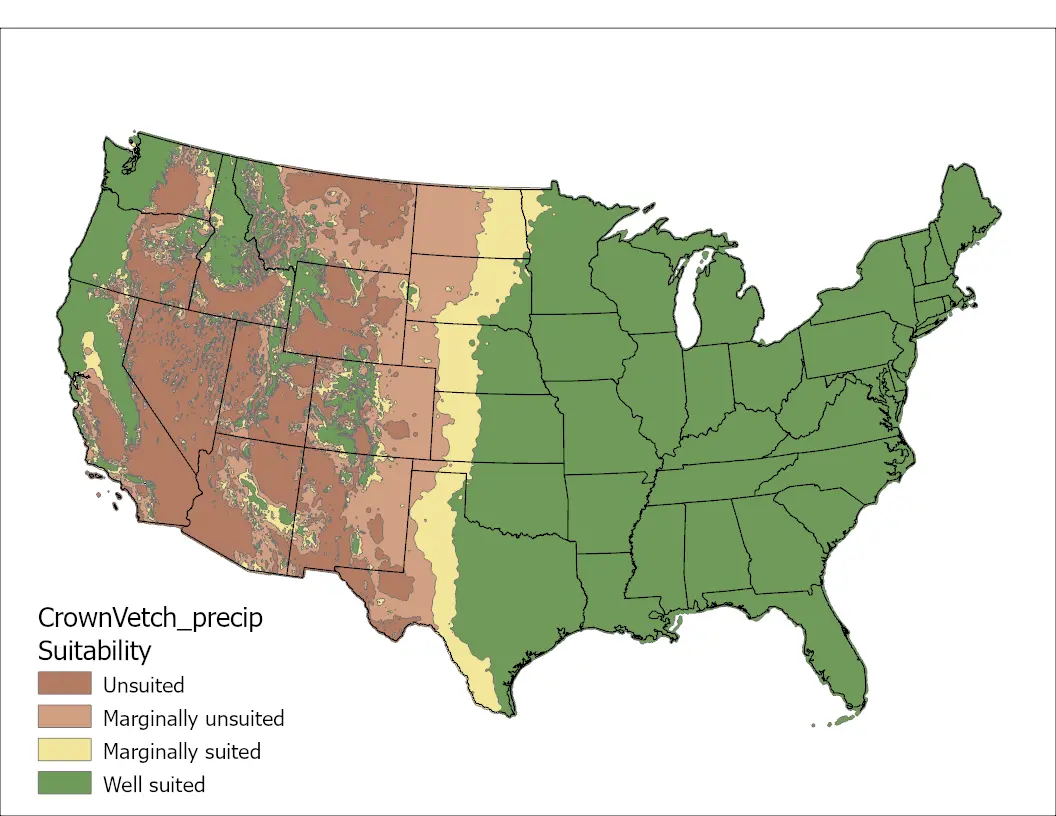
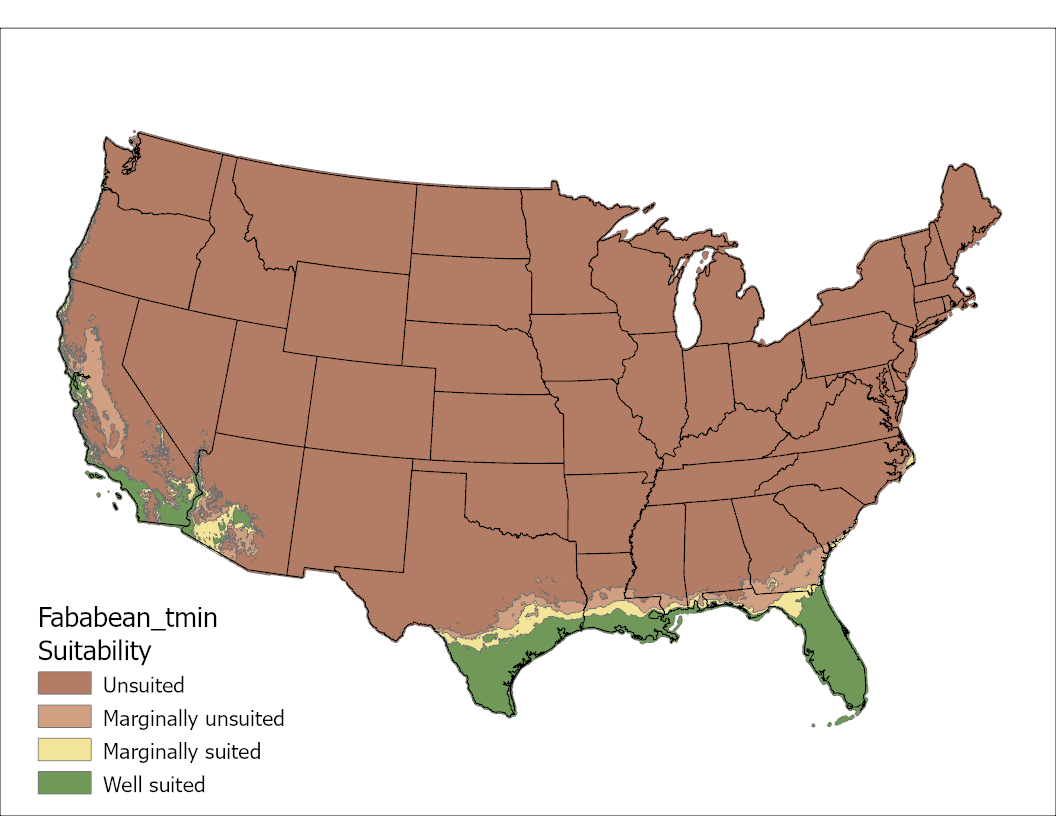
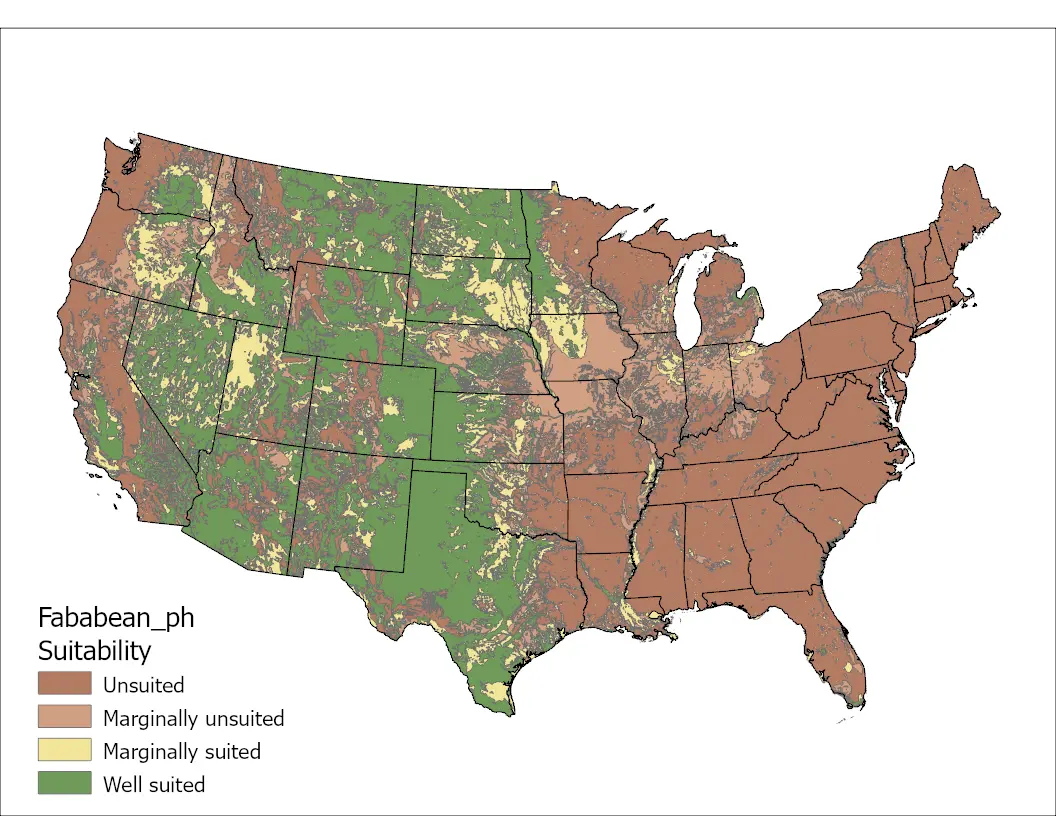
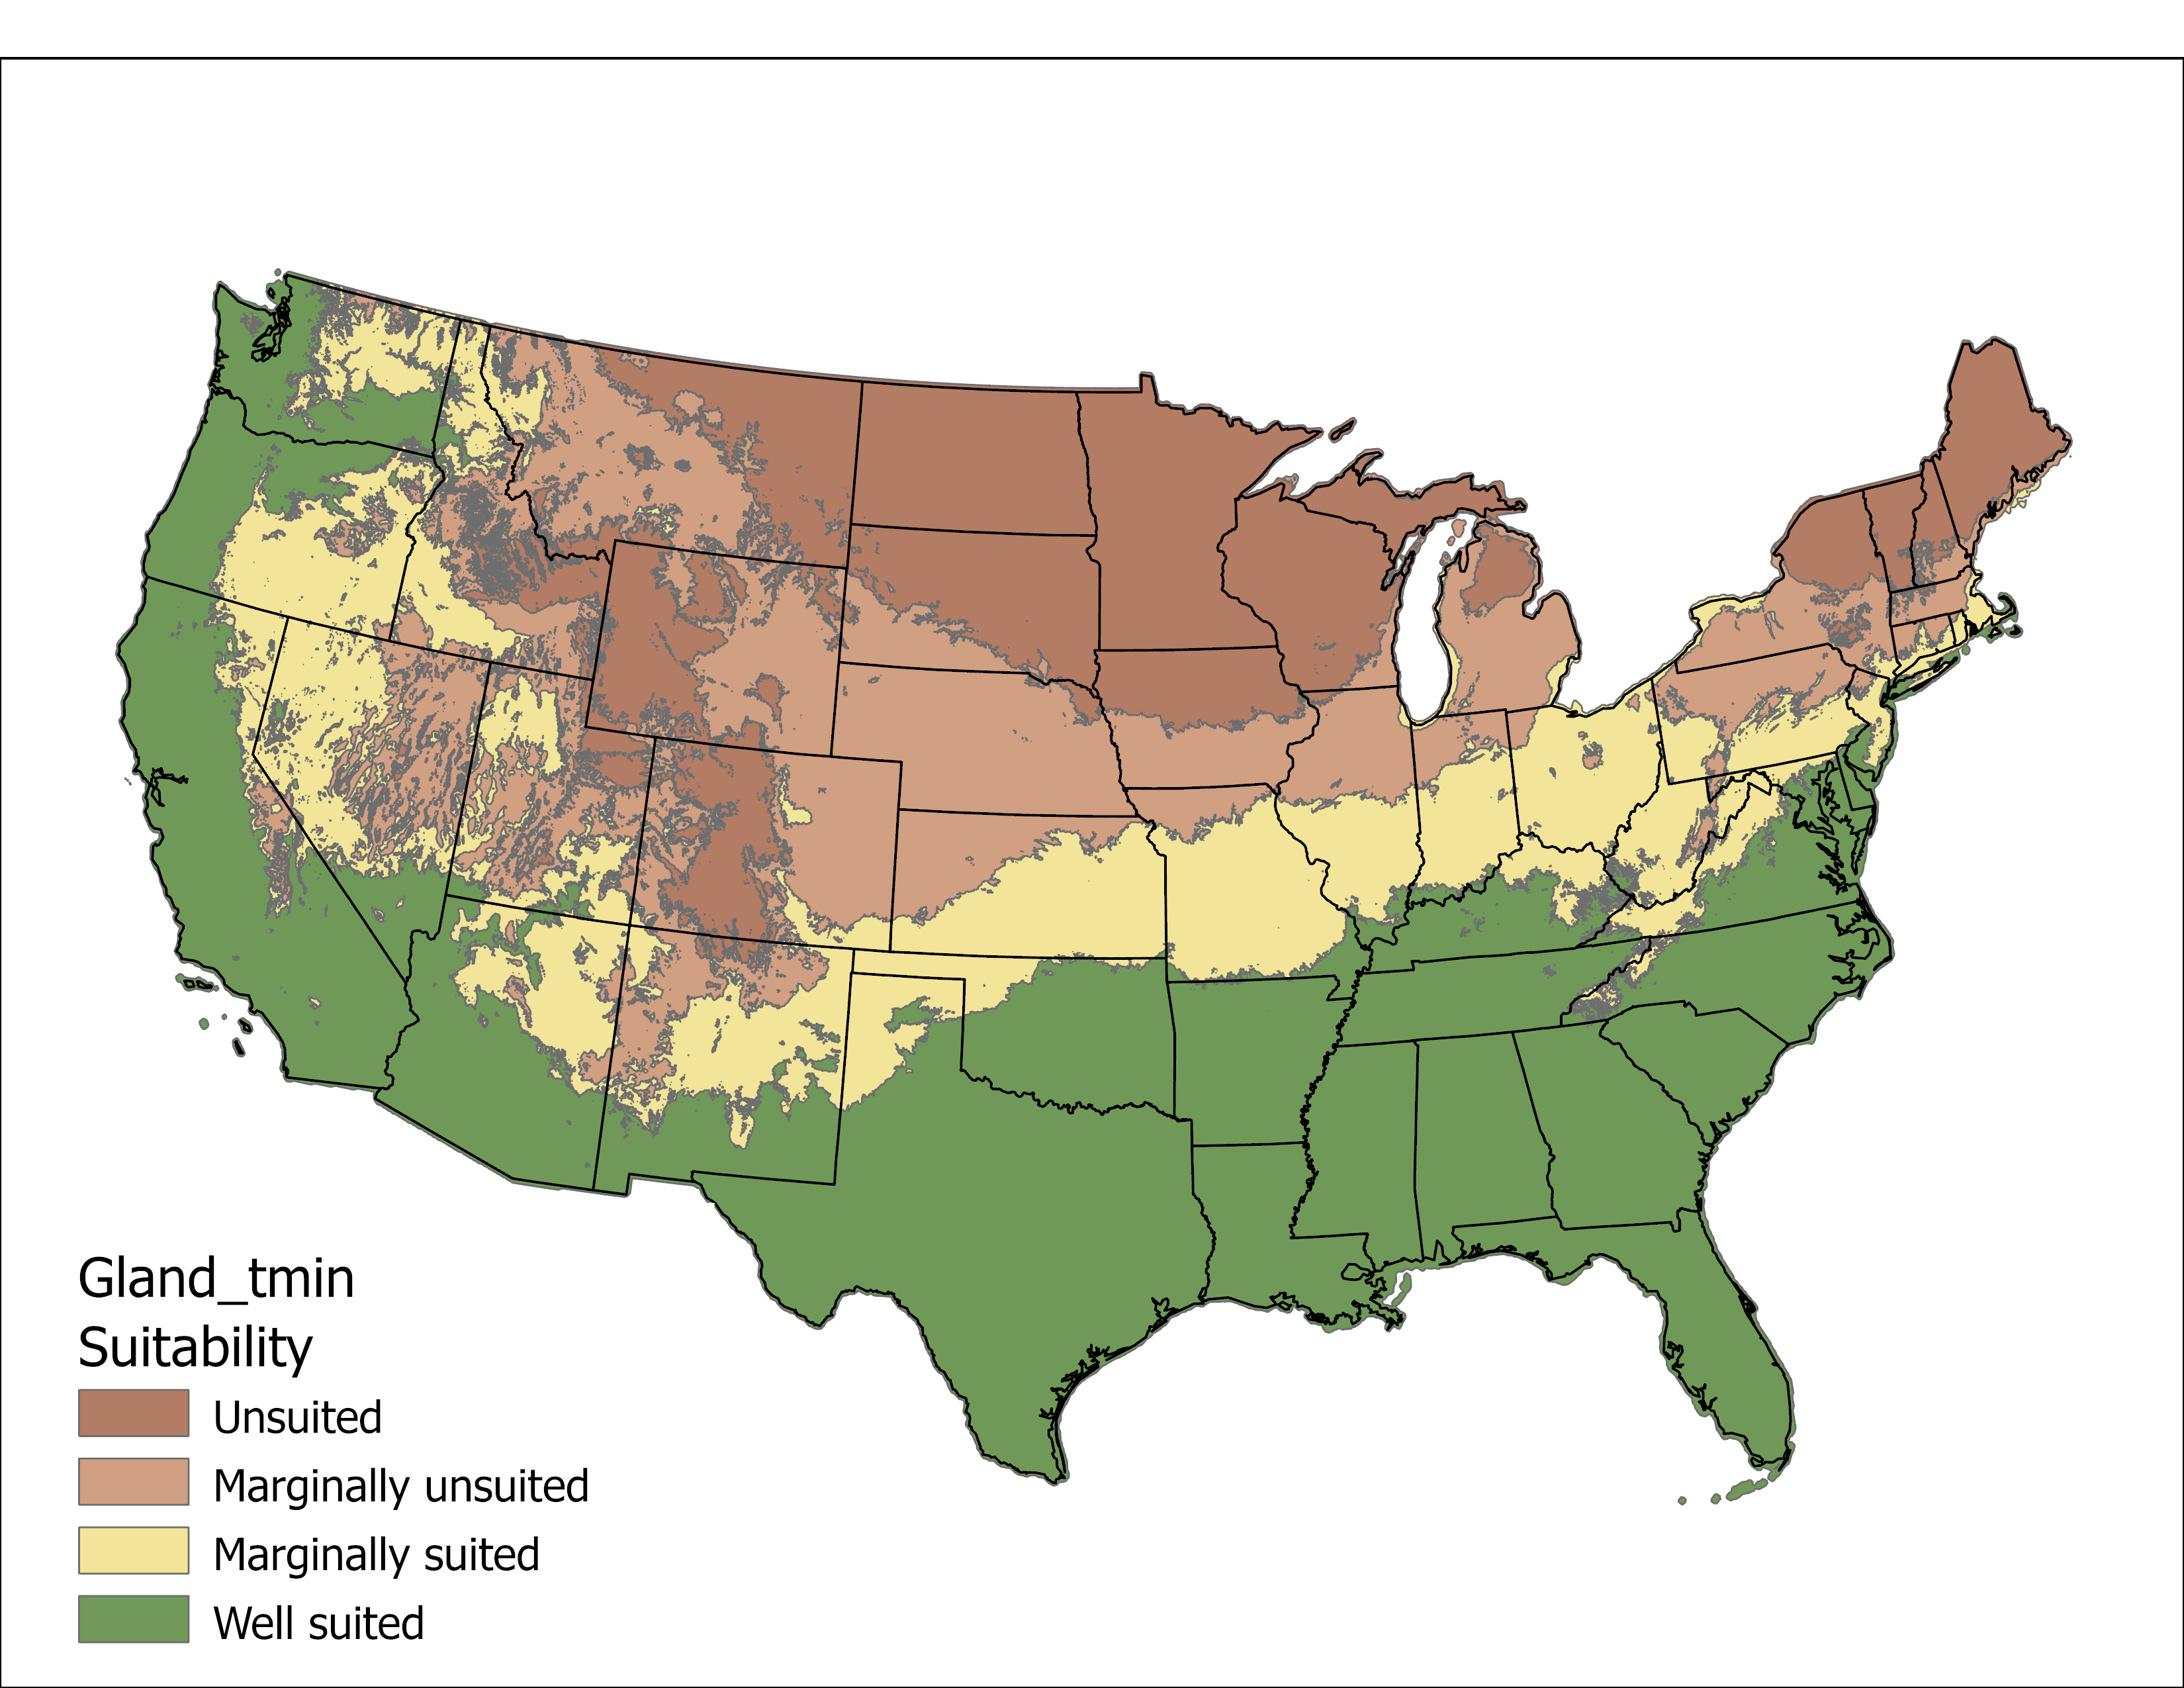
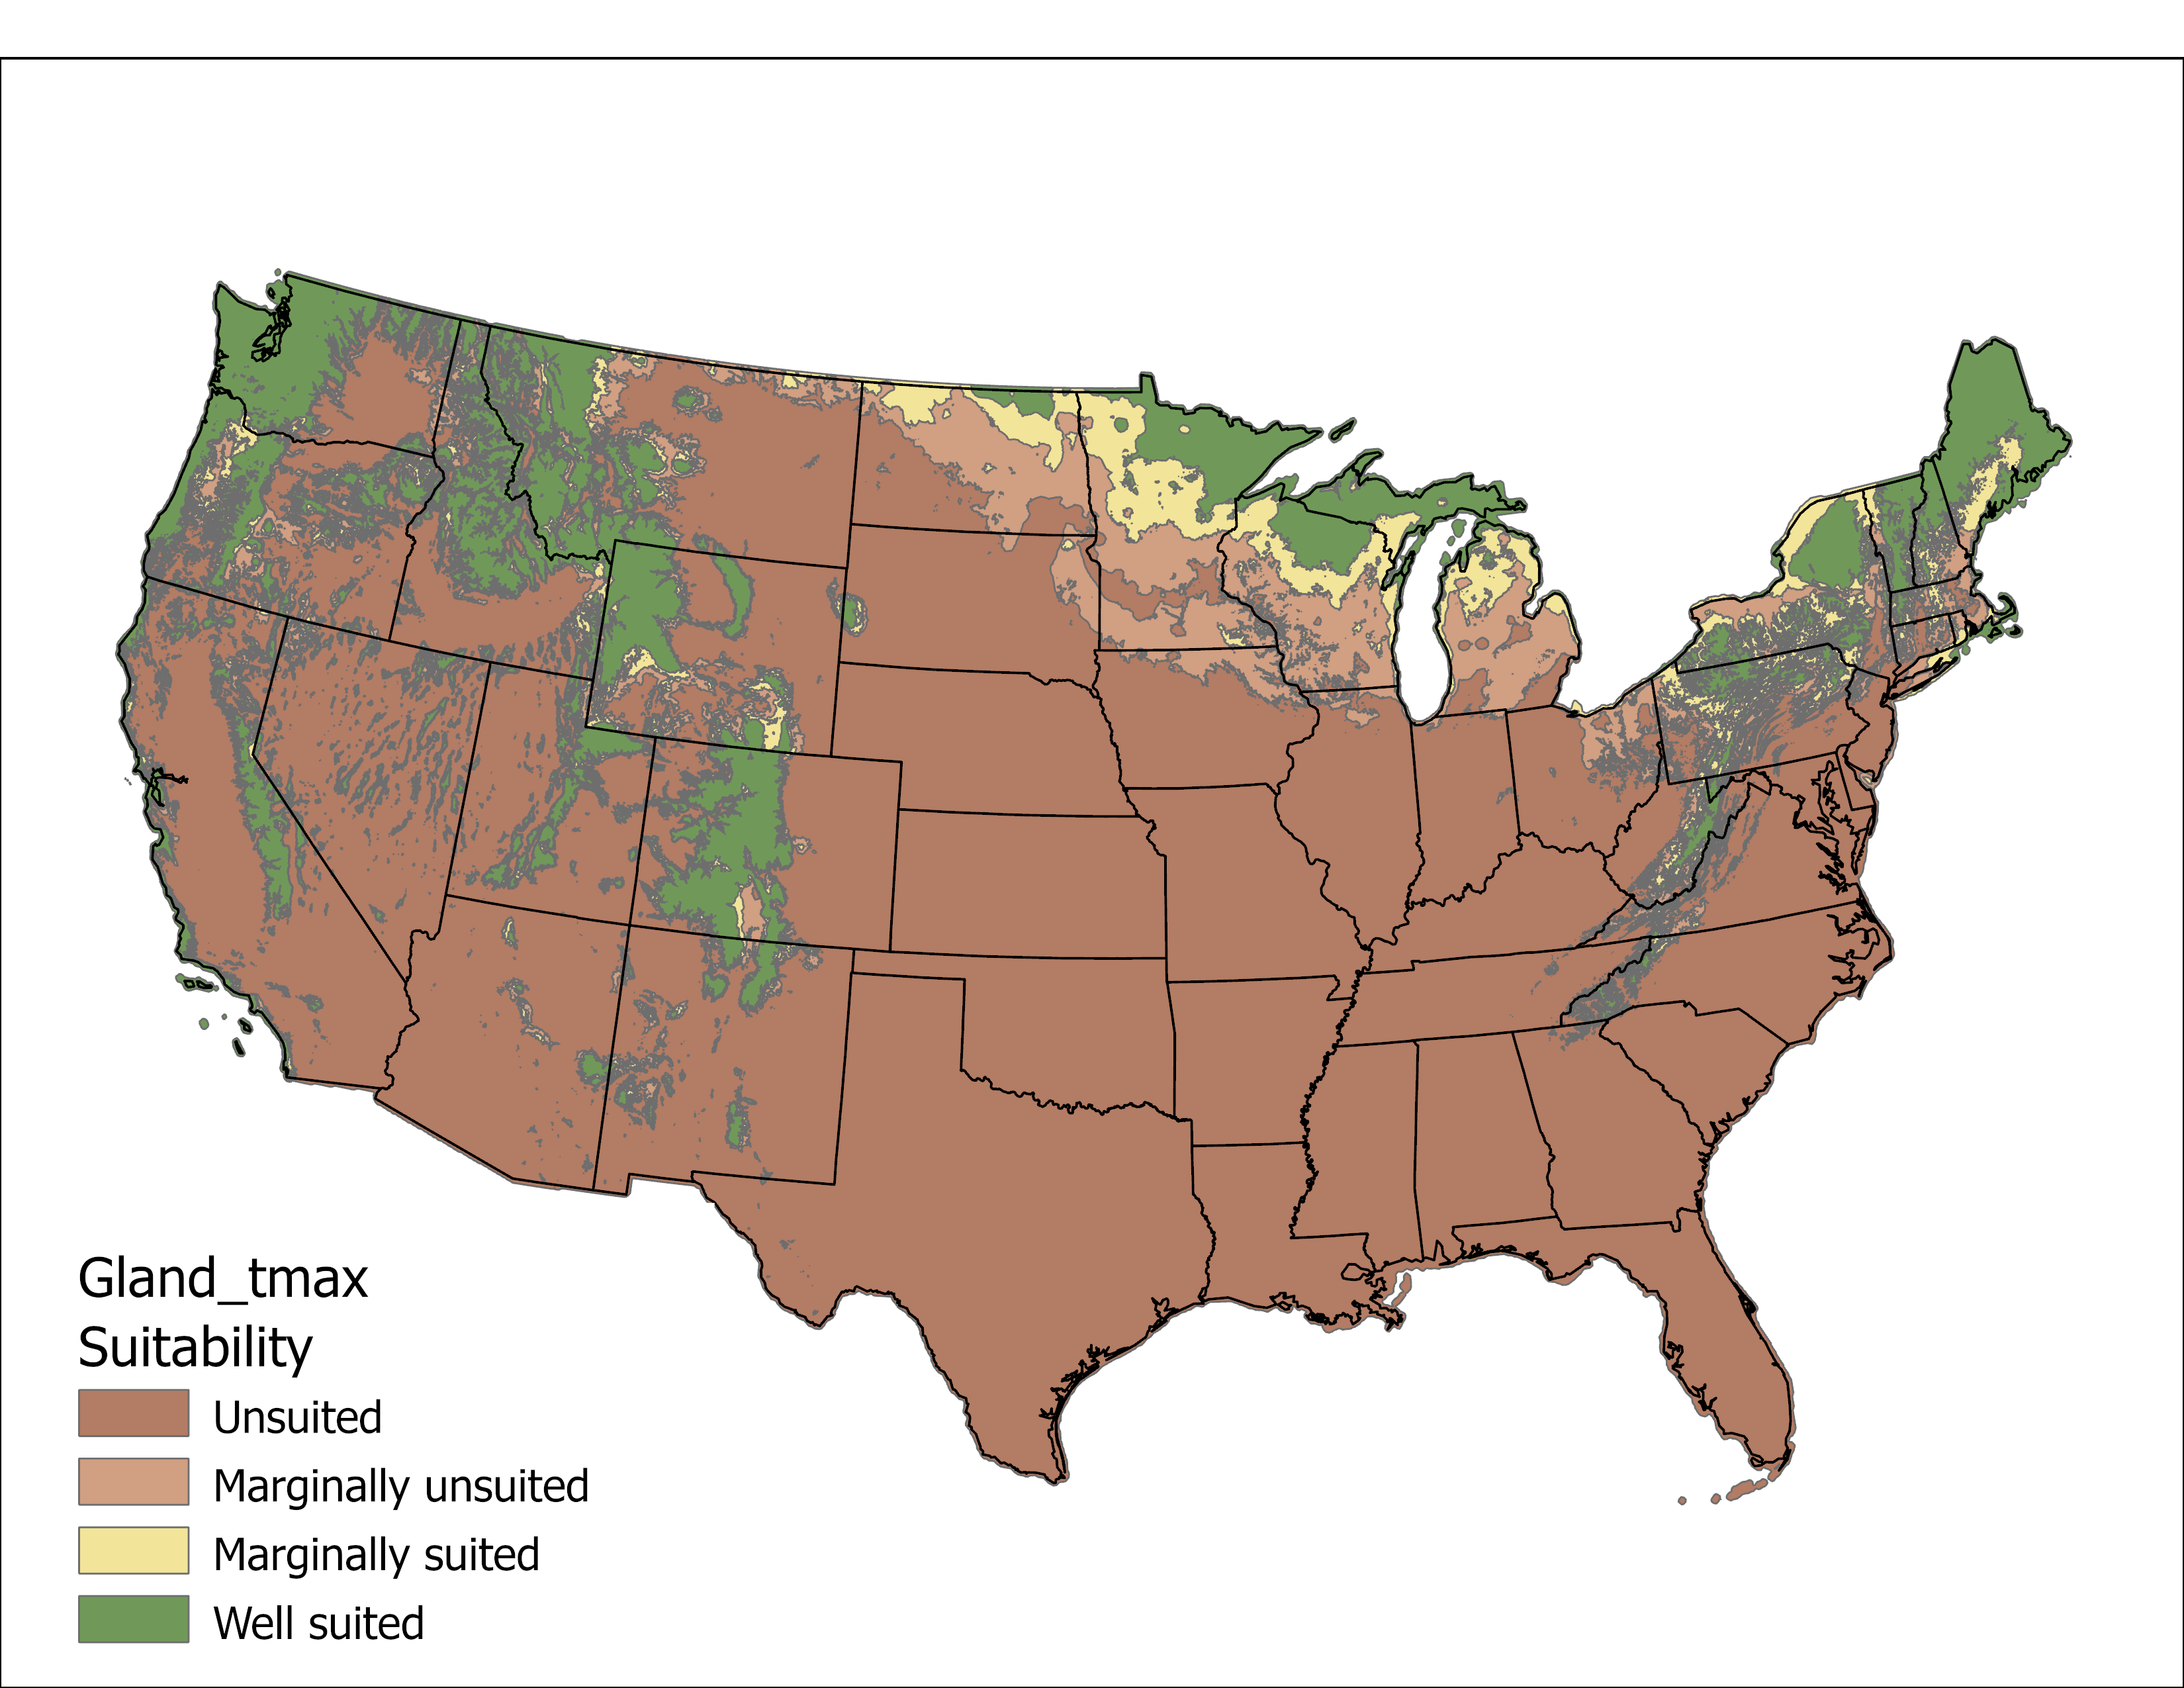
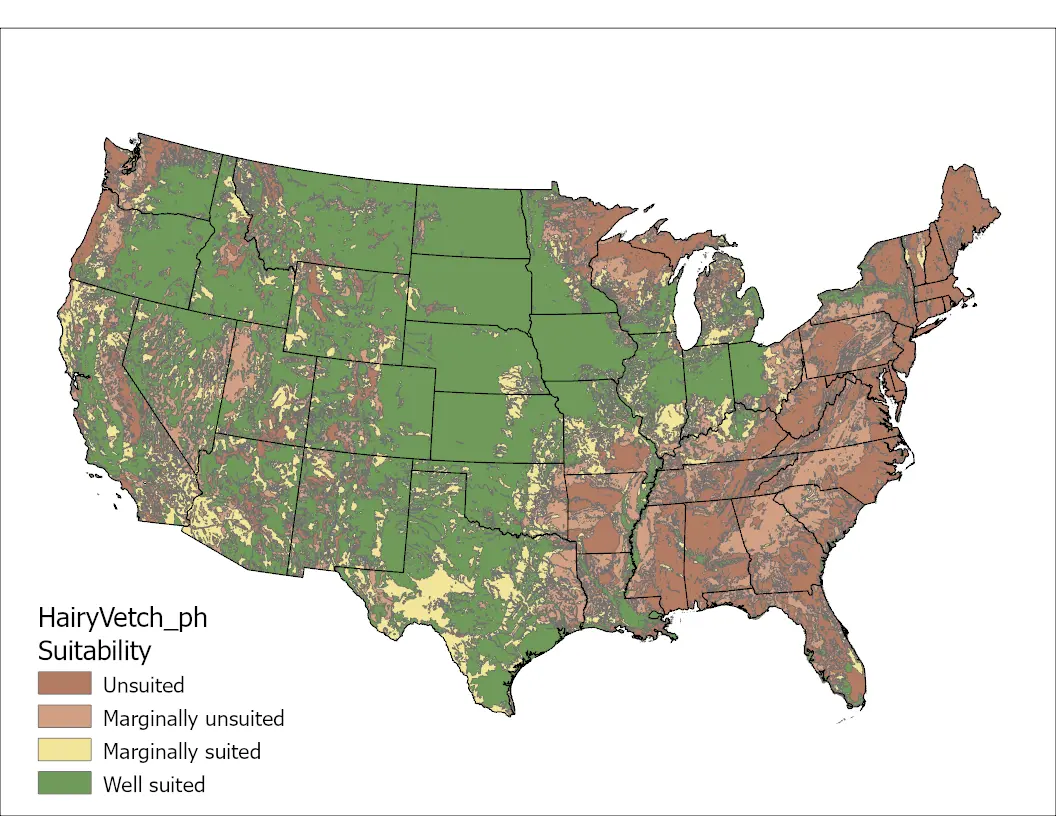
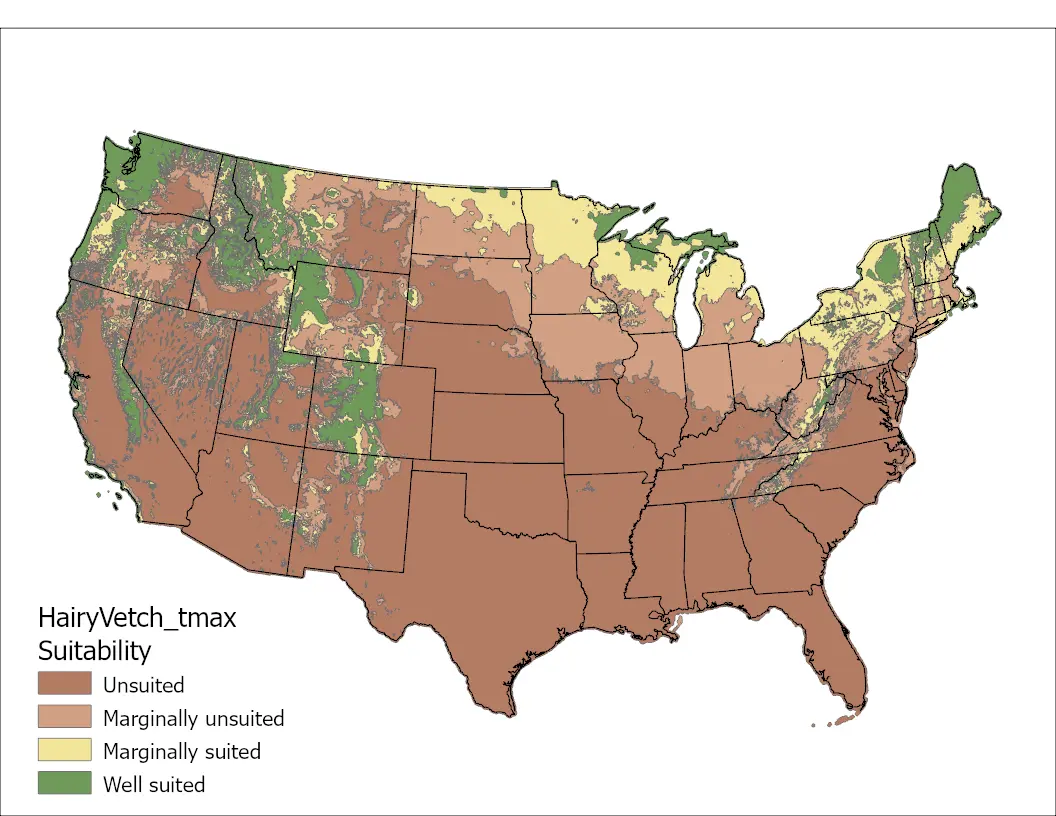
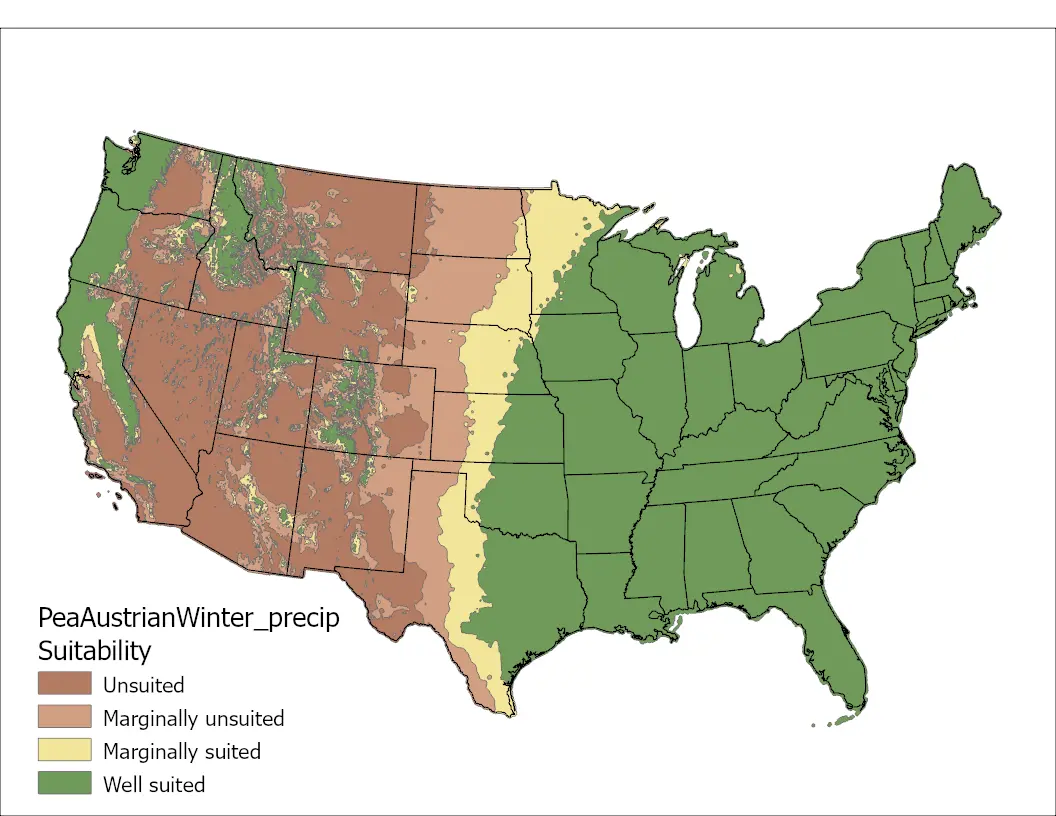
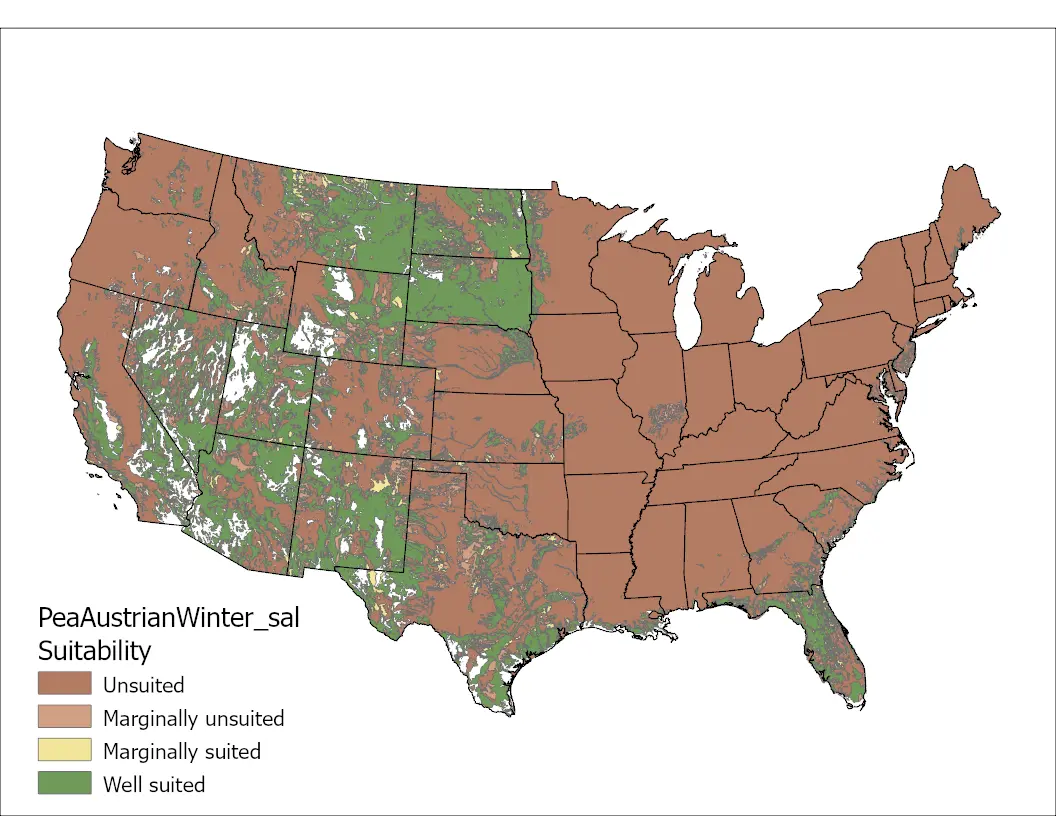
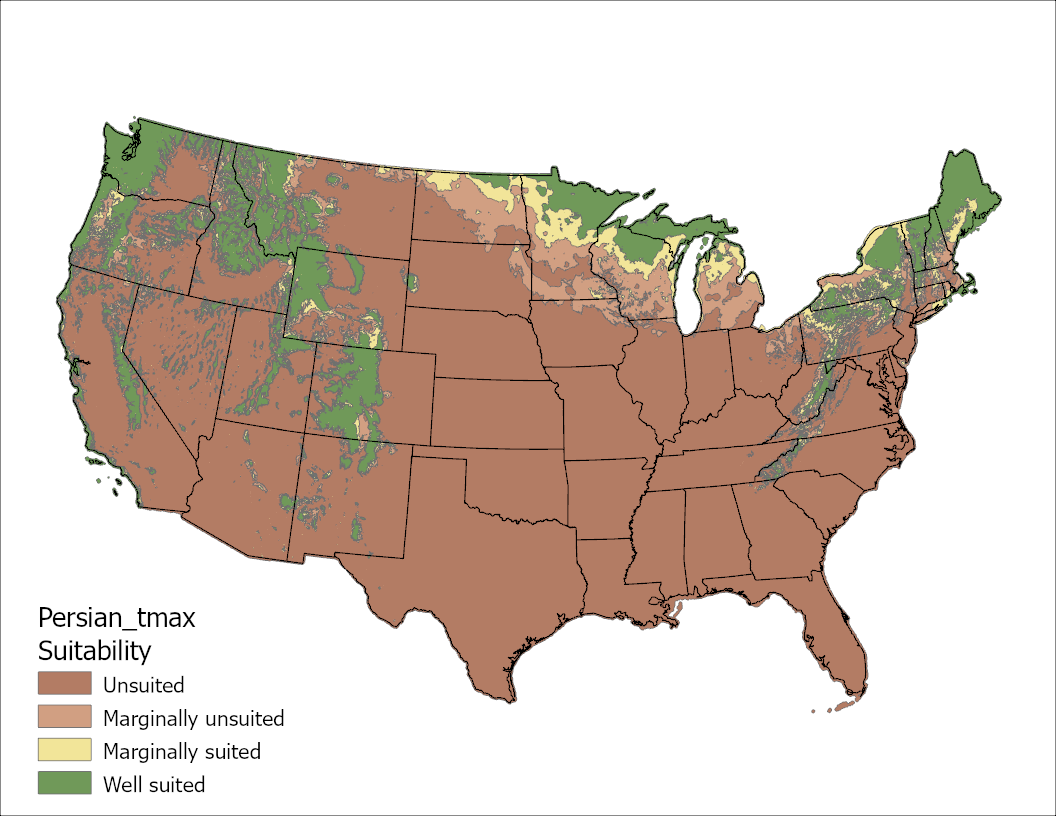
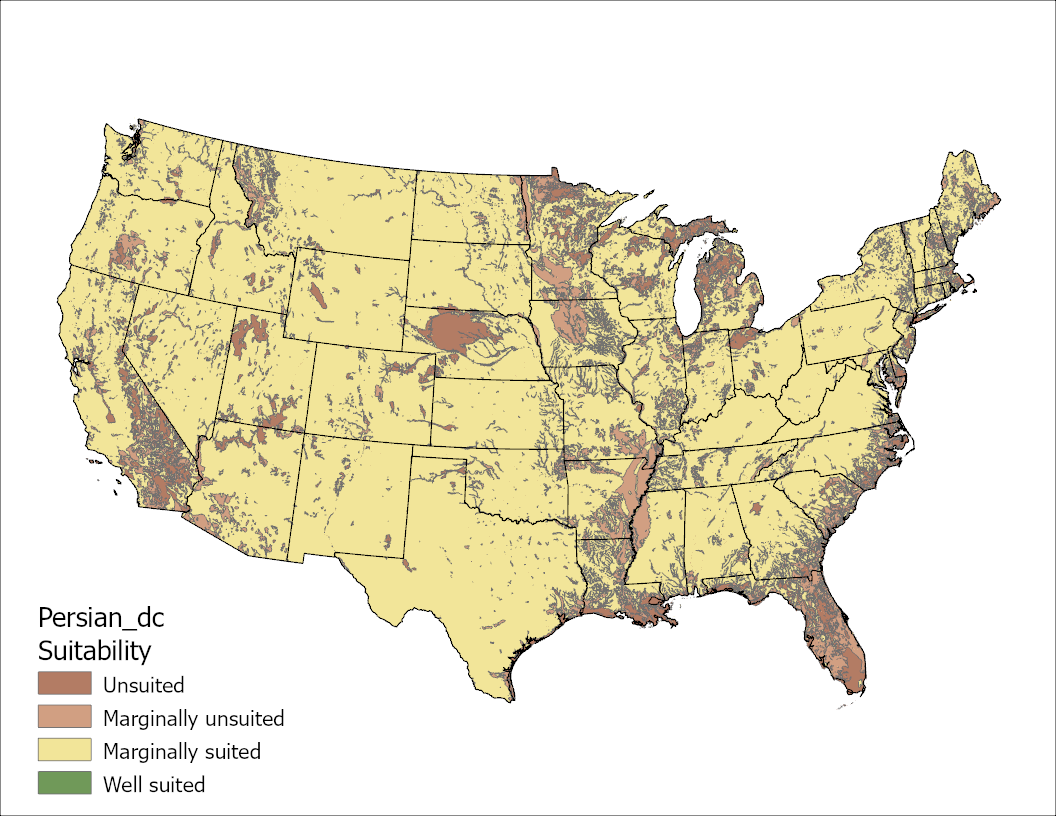
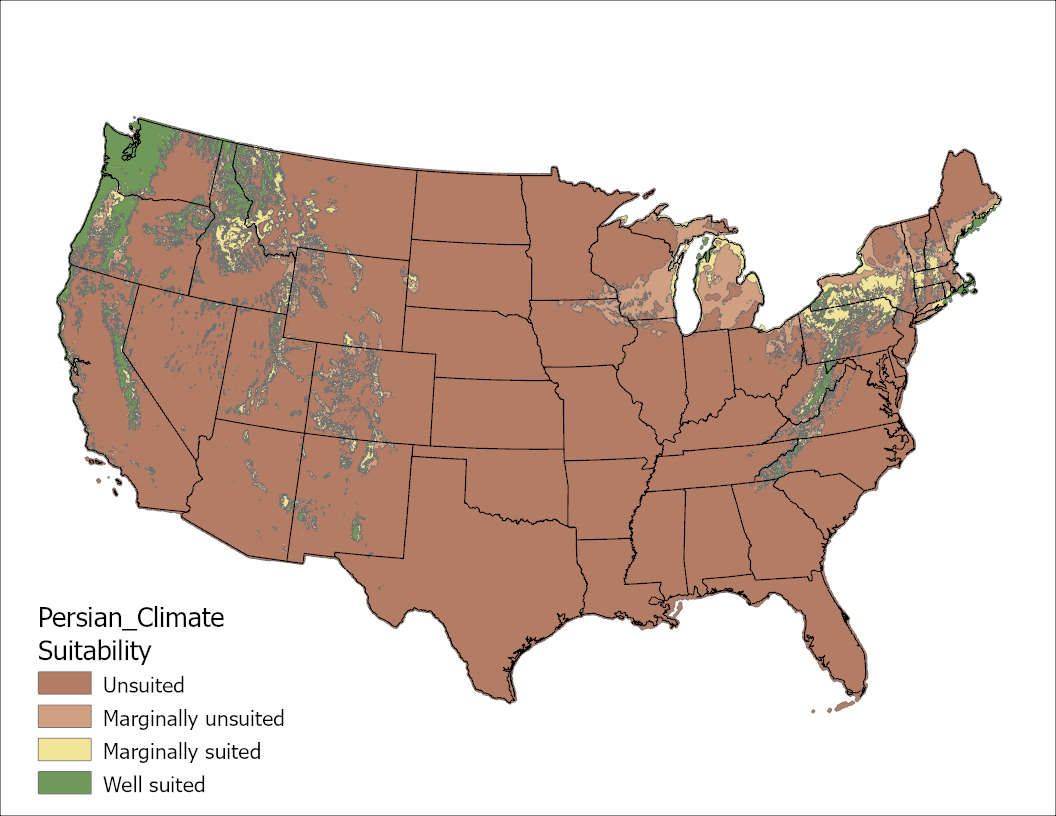
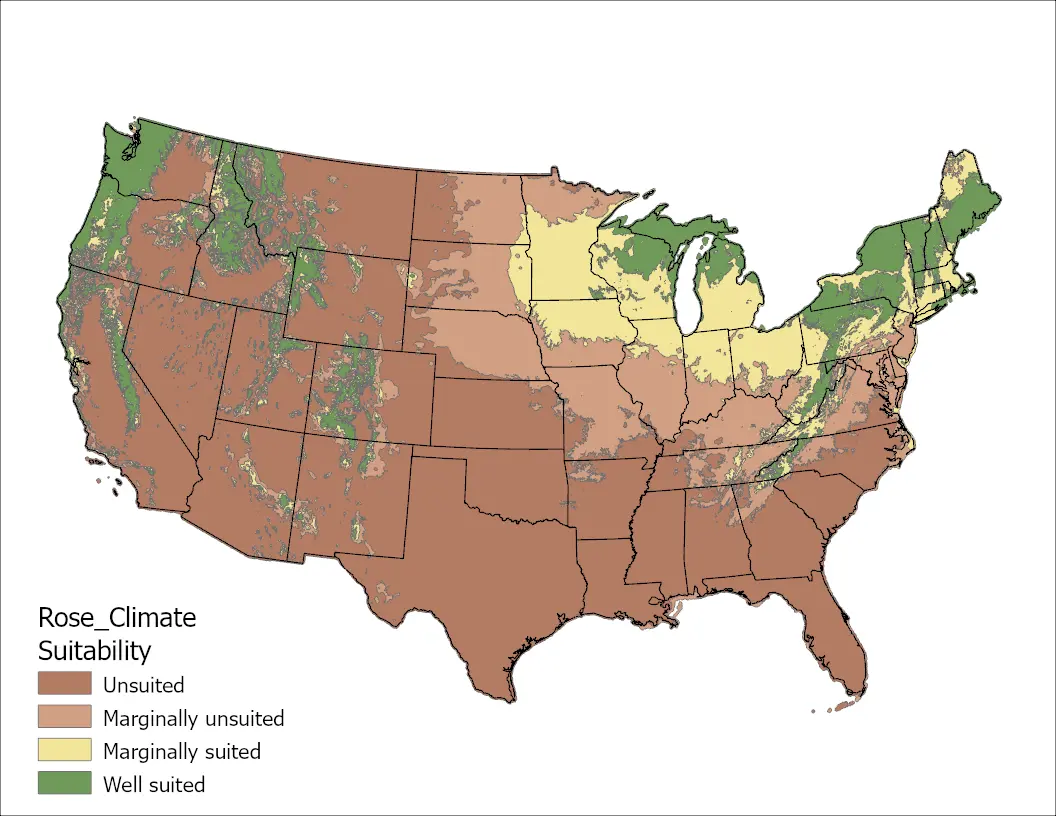
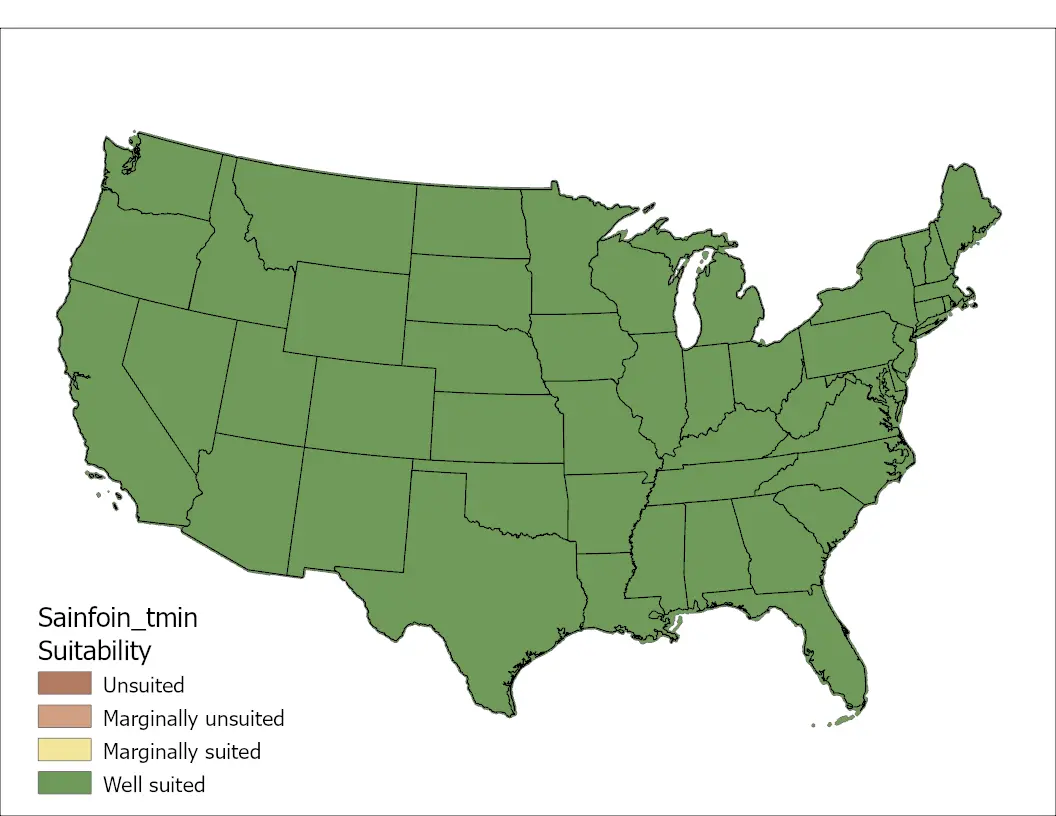
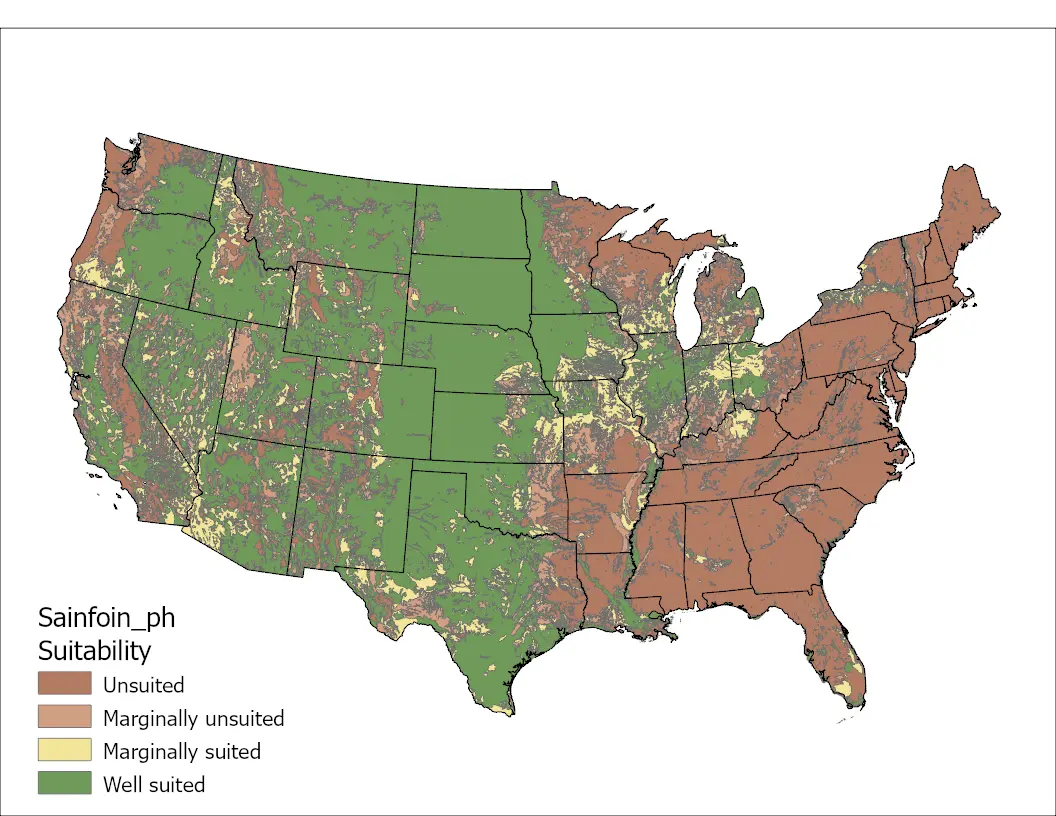
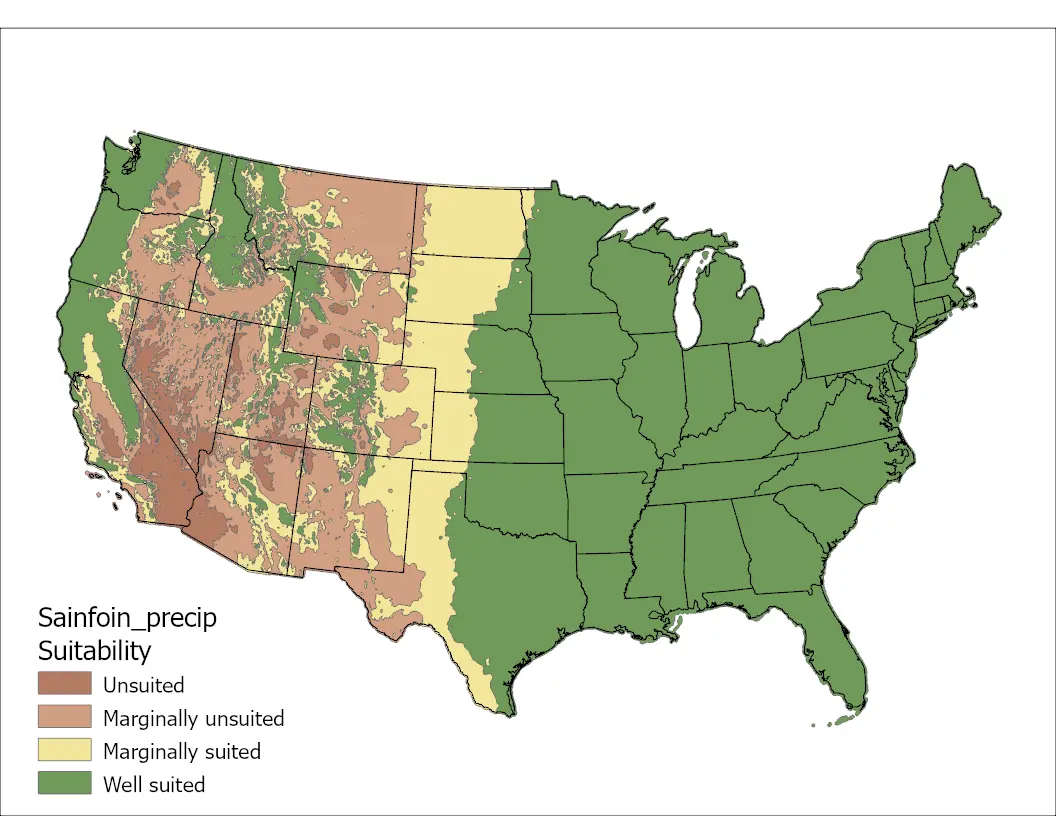
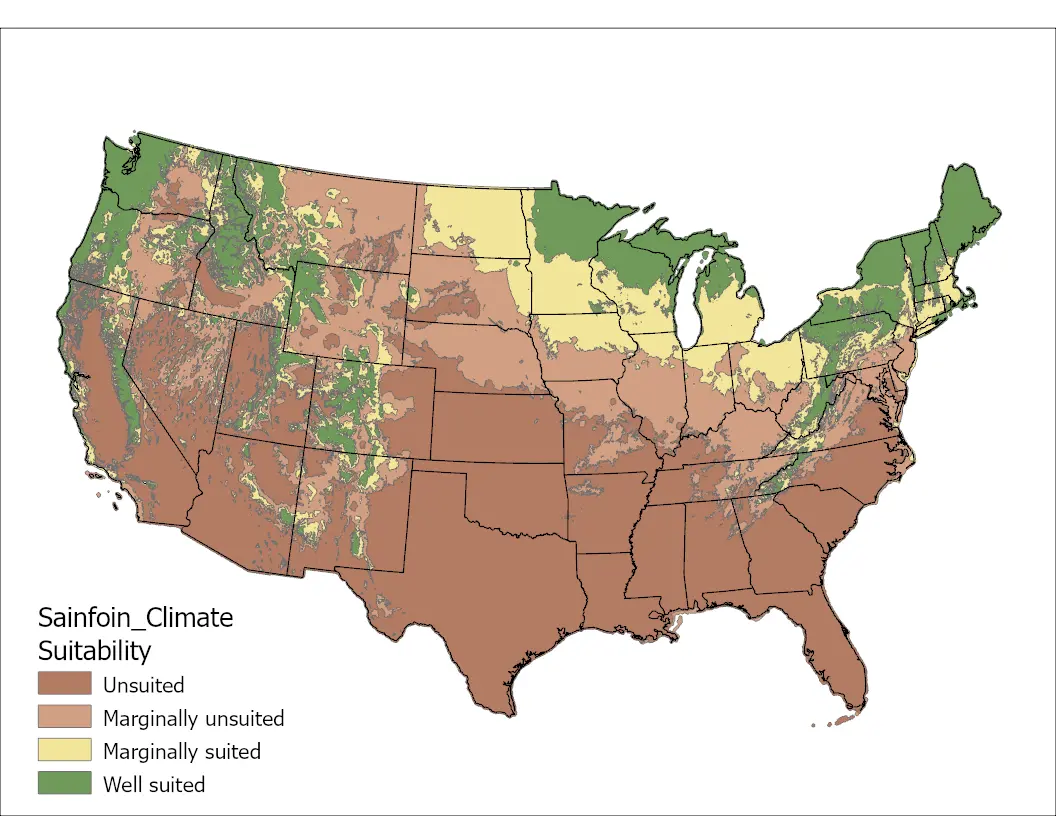
Suitability patterns for forage species are caused by different factors in different locations. Low winter temperatures limit the northern range of many species, while low precipitation limits the western range of species in the semi-arid west. Low summer temperatures limit the range of species with increasing elevation while high summer temperatures limit the range in the desert southwest and hot and humid southeast. Soil characteristics (pH, drainage, and salinity) also limit the suitability zones of forage species. However, soil amendments (liming and drainage tiles) can alleviate many of these limitations. Thus, NRCS Soil Survey data should be informed and revised by management mitigations.
GIS software allow creation of highly detailed and accurate species suitability mapping based on biophysical characteristics of the region and plant characteristics (Hannaway et al., 2005). Precipitation and maximum and minimum temperature climate grids are now available for annual and monthly periods. Soil type, depth, drainage, pH, salinity, and alkalinity information was obtained from the NRCS STATSGO2 database. Species characteristics were provided by forage experts.
Hannaway, D.B., C. Daly, L. Coop, D. Chapman, and Y. Wei. 2005. GIS-based Forage Species Adaptation Mapping. pp. 319-342. In: S.G. Reynolds and J. Frame (eds). Grasslands: Developments, Opportunities and Perspectives. FAO and Science Pub. Inc., Rome, Italy.
Maps
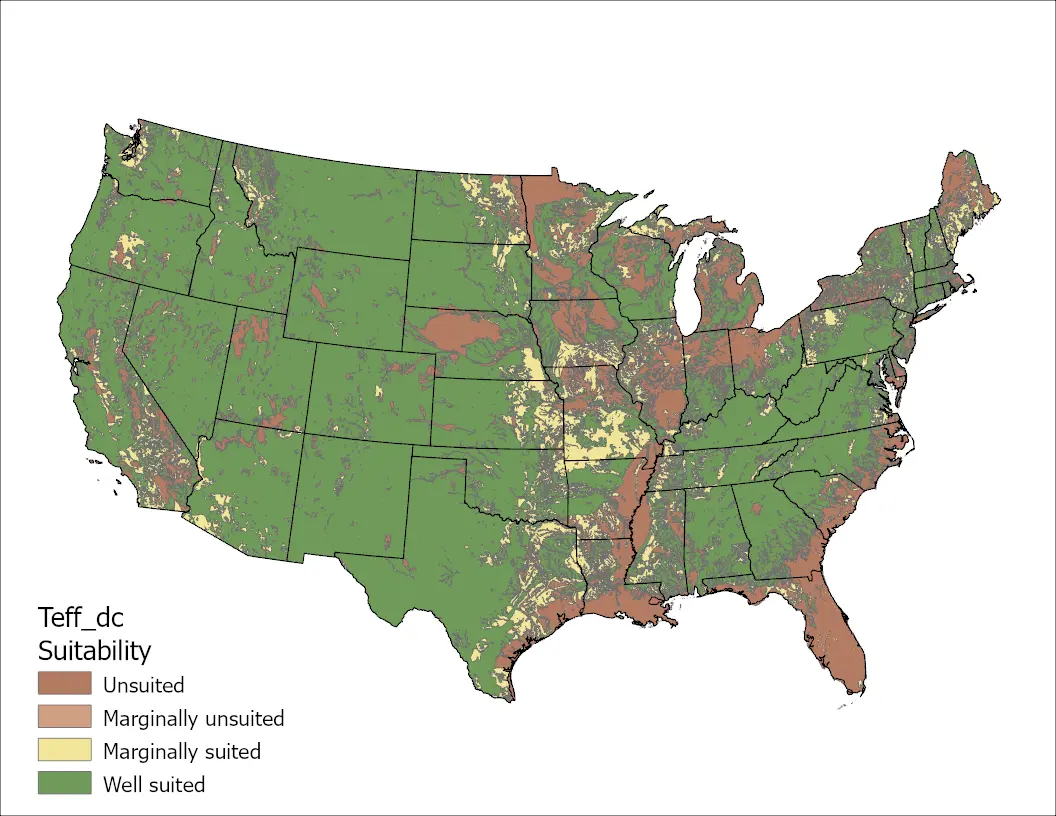
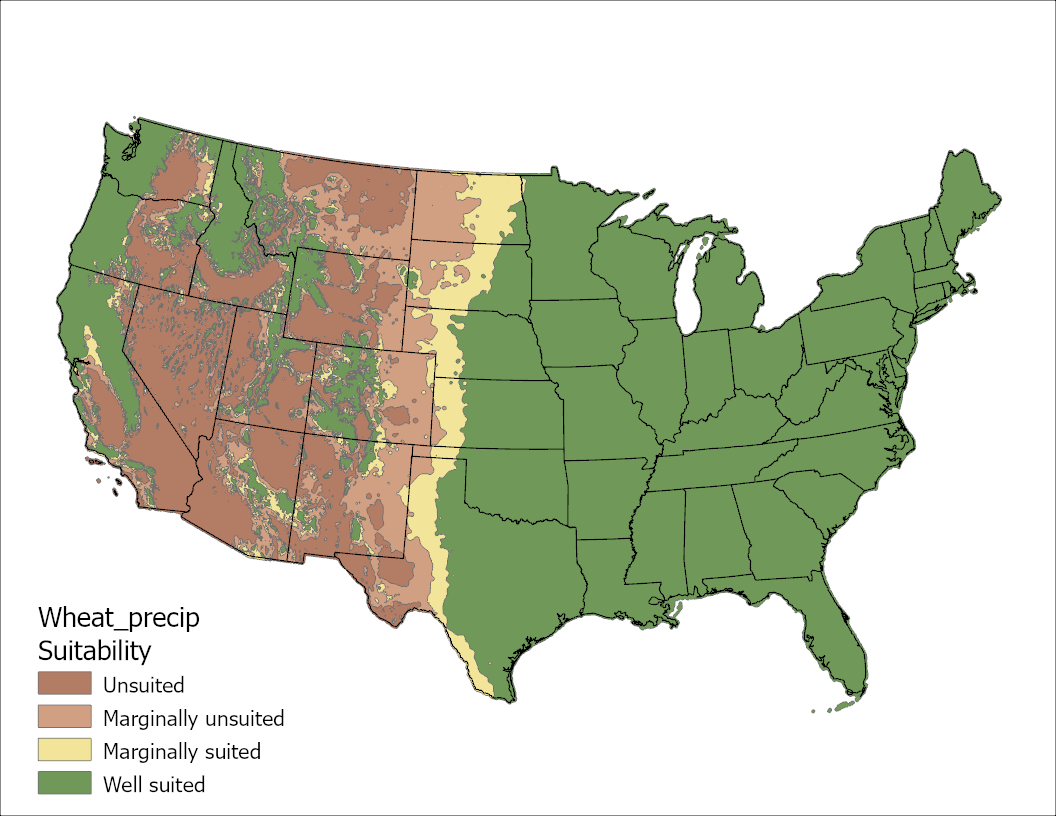
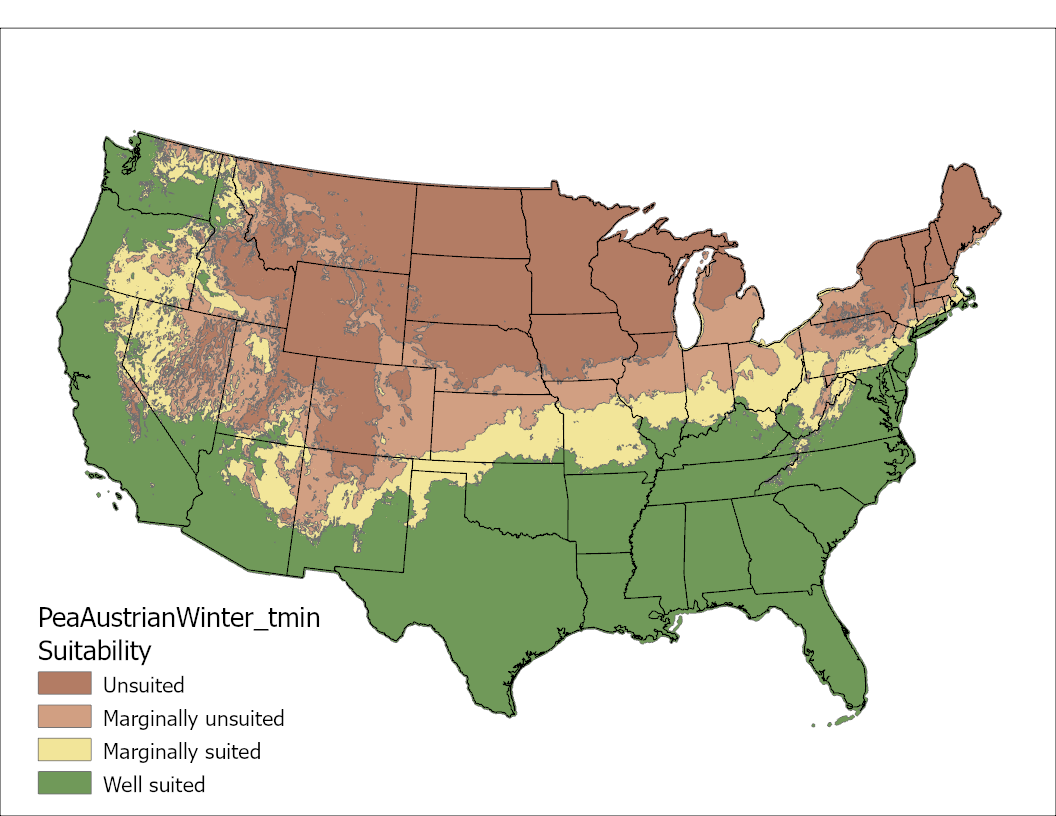
Nine maps were developed; 1) 30-year long-term July maximum temperature 2) 30-year long-term January minimum temperature, 3) 30-year long-term annual precipitation, 4) soil pH, 5) soil drainage, 6) soil salinity, 7) combined climate factors, 8) combined soil factors, and 9) combined climate and soil factors.
The Contiguous USA
|
Climate Factors |
Soil Factors | All Factors Combined |
|---|---|---|
|
Minimum Temperature Image

|
pH Image

|
Climate and Soil Image

|
|
Maximum Temperature Image

|
Drainage Image

|
All Soil Image

|
|
Precipitation Image

|
Salinity Image

|
All Climate Image

|
Click on the thumbnail image to view a larger map.


To create highly detailed and accurate species suitability maps it was necessary to change from a qualitative description of plant characteristics to an approach that defines tolerances quantitatively. Tolerances to climatic and soil factors were defined (Table 1) and used to map suitability based on summary publications (Moser et al., 1996) and expert knowledge of forage scientists.
Moser, L.E, D.R. Buxton, and M.D. Casler, Eds. 1996. Cool Season Forage Grasses. American Society of Agronomy Monograph 34. 841 pp. ASA, CSSA, and SSSA, Madison, WI.
Suitability patterns for forage species are caused by different factors in different locations. Low winter temperatures limit the northern range of many species, while low precipitation limits the western range of species in the semi-arid west. Low summer temperatures limit the range of species with increasing elevation while high summer temperatures limit the range in the desert southwest and hot and humid southeast. Soil characteristics (pH, drainage, and salinity) also limit the suitability zones of forage species. However, soil amendments (liming and drainage tiles) can alleviate many of these limitations. Thus, NRCS Soil Survey data should be informed and revised by management mitigations.
GIS software allow creation of highly detailed and accurate species suitability mapping based on biophysical characteristics of the region and plant characteristics (Hannaway et al., 2005). Precipitation and maximum and minimum temperature climate grids are now available for annual and monthly periods. Soil type, depth, drainage, pH, salinity, and alkalinity information was obtained from the NRCS STATSGO2 database. Species characteristics were provided by forage experts.
Hannaway, D.B., C. Daly, L. Coop, D. Chapman, and Y. Wei. 2005. GIS-based Forage Species Adaptation Mapping. pp. 319-342. In: S.G. Reynolds and J. Frame (eds). Grasslands: Developments, Opportunities and Perspectives. FAO and Science Pub. Inc., Rome, Italy.
Maps
Nine maps were developed; 1) 30-year long-term July maximum temperature 2) 30-year long-term January minimum temperature, 3) 30-year long-term annual precipitation, 4) soil pH, 5) soil drainage, 6) soil salinity, 7) combined climate factors, 8) combined soil factors, and 9) combined climate and soil factors.
Climate: Tmax, Tmin, Ppt, Combined
Soil: pH, Drainage, Salinity, Combined
All Factors
The Contiguous USA
|
Climate Factors |
Soil Factors | All Factors Combined |
|---|---|---|
|
Minimum Temperature Image
|
pH Image
|
Climate and Soil Image
|
|
Maximum Temperature Image
|
Drainage Image
|
All Soil Image
|
|
Precipitation Image
|
Salinity Image
|
All Climate Image
|
Click on the thumbnail image to view a larger map.
Suitability Maps
Based on literature and expert rye specialist counsel, climatic and soil tolerances were compiled. Nine maps were created for rye, one for each of 3 climate factors and one for each of the soil factors, one combined climate factors map, one combined soil factors map, and a map for all of the factors. This allows for each factor to be examined and addressed to improve suitability through management. Small images of maps are provided below, with larger maps provided in the web segment, linked by clicking. For spring rye, all factors except for Tmin values would be the same.
The Contiguous USA
|
Climate Factors |
Soil Factors | All Factors Combined |
|---|---|---|
|
Minimum Temperature Image

|
pH Image

|
Climate and Soil Image

|
|
Maximum Temperature Image

|
Drainage Image

|
All Soil Image

|
|
Precipitation Image

|
Salinity Image

|
All Climate Image

|
Click on the thumbnail image to view a larger map.


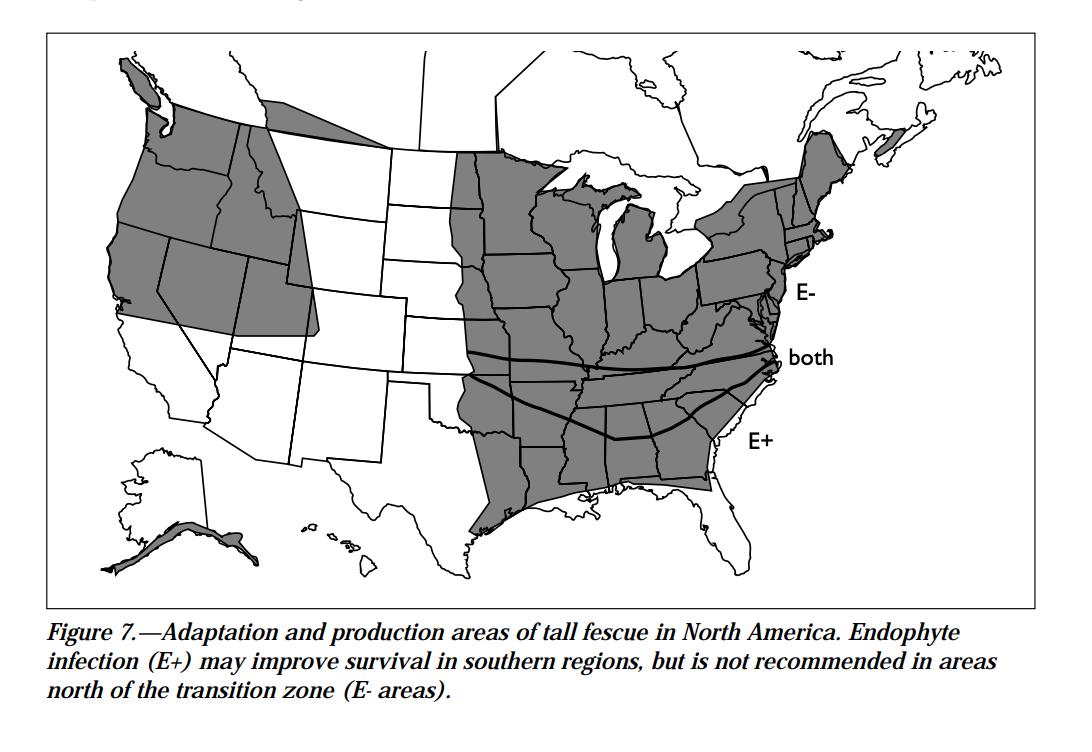
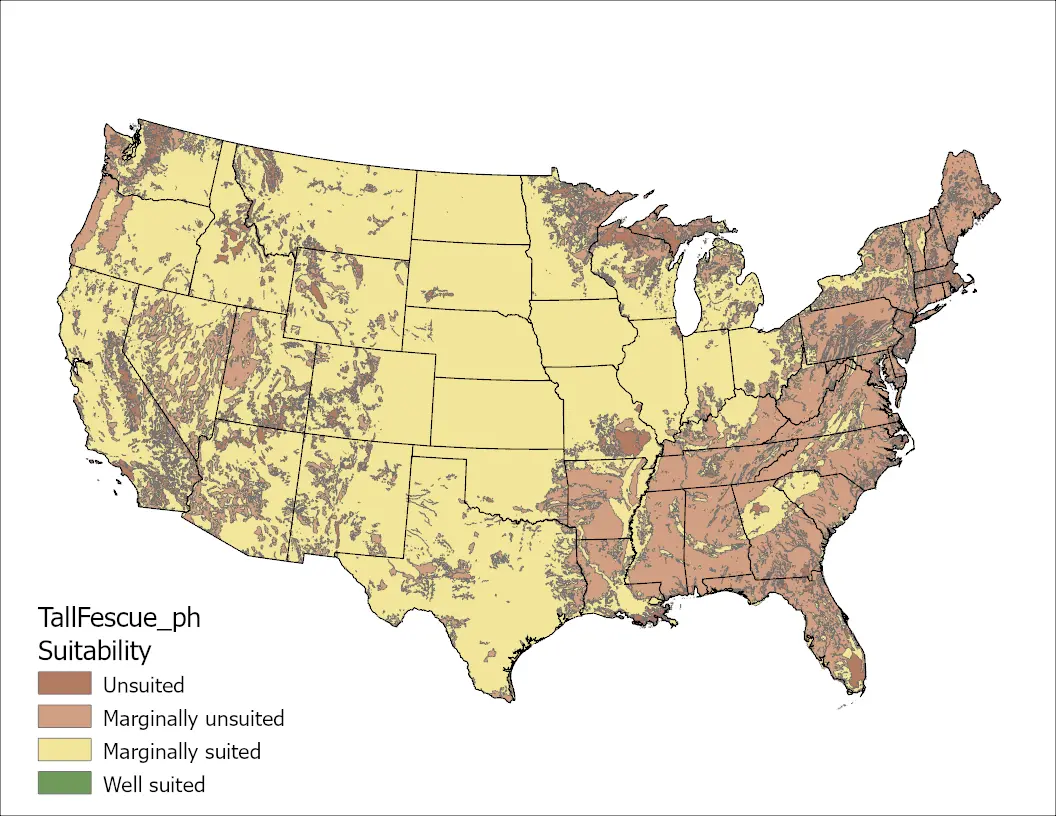
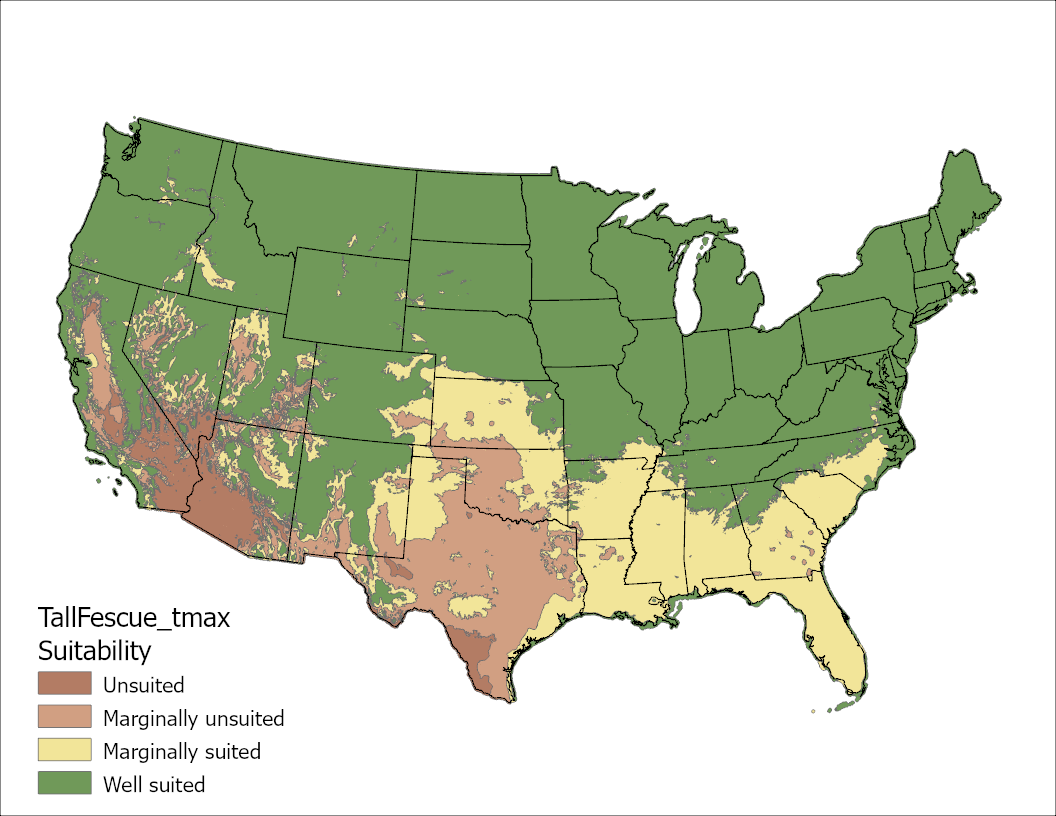
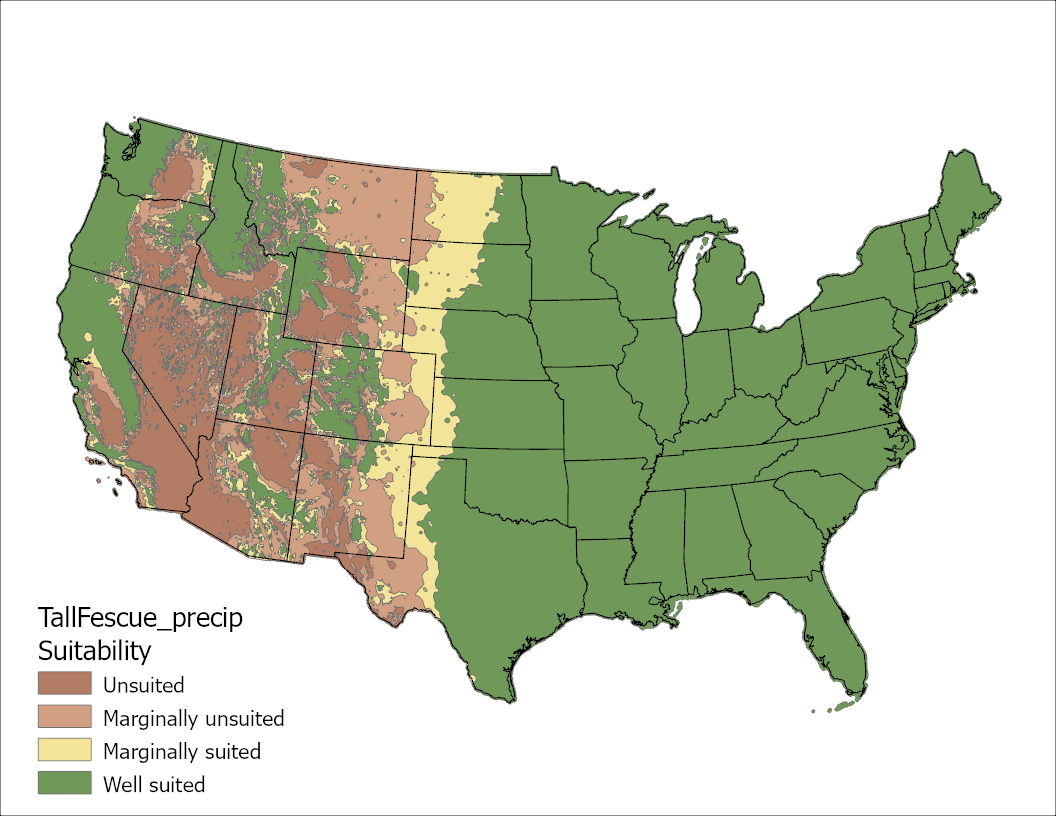
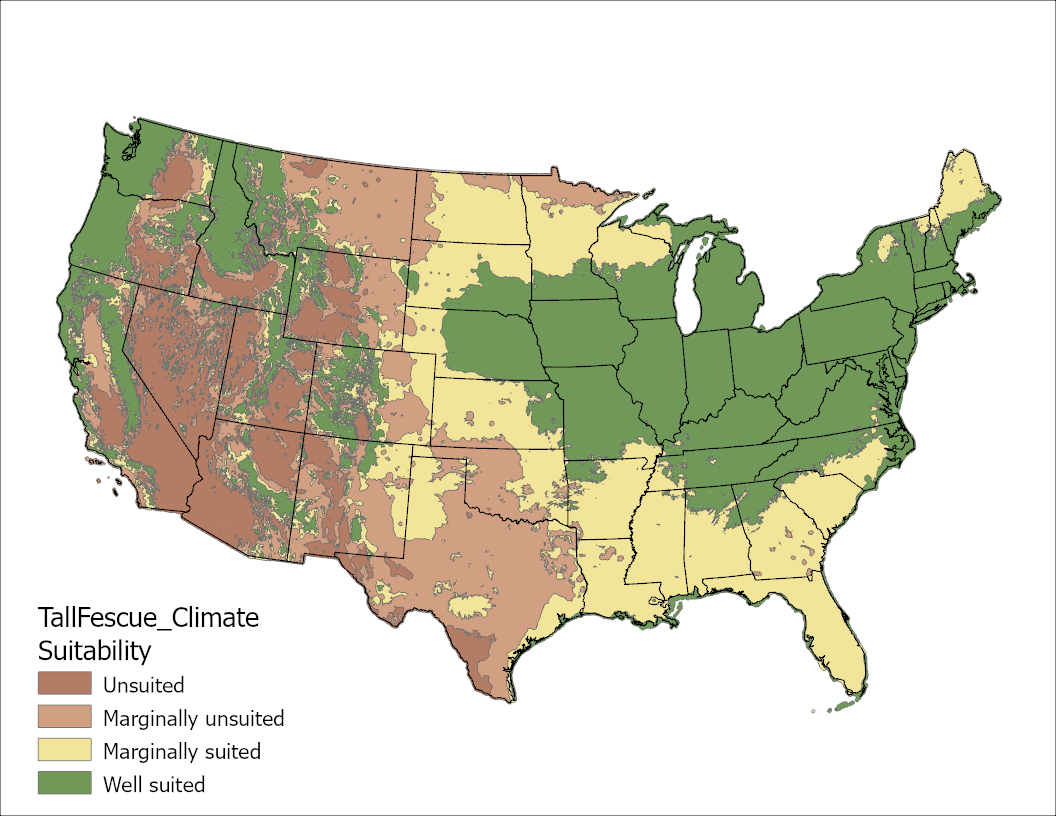
From OSU PNW 504. Tall Fescue: https://agsci.oregonstate.edu/sites/agscid7/files/pnw504.pdf
The Contiguous USA
|
Climate Factors |
Soil Factors | All Factors Combined |
|---|---|---|
|
Minimum Temperature Image
|
pH Image
|
Climate and Soil Image

|
|
Maximum Temperature Image
|
Drainage Image

|
All Soil Image

|
|
Precipitation Image
|
Salinity Image

|
All Climate Image
|
Click on the thumbnail image to view a larger map.


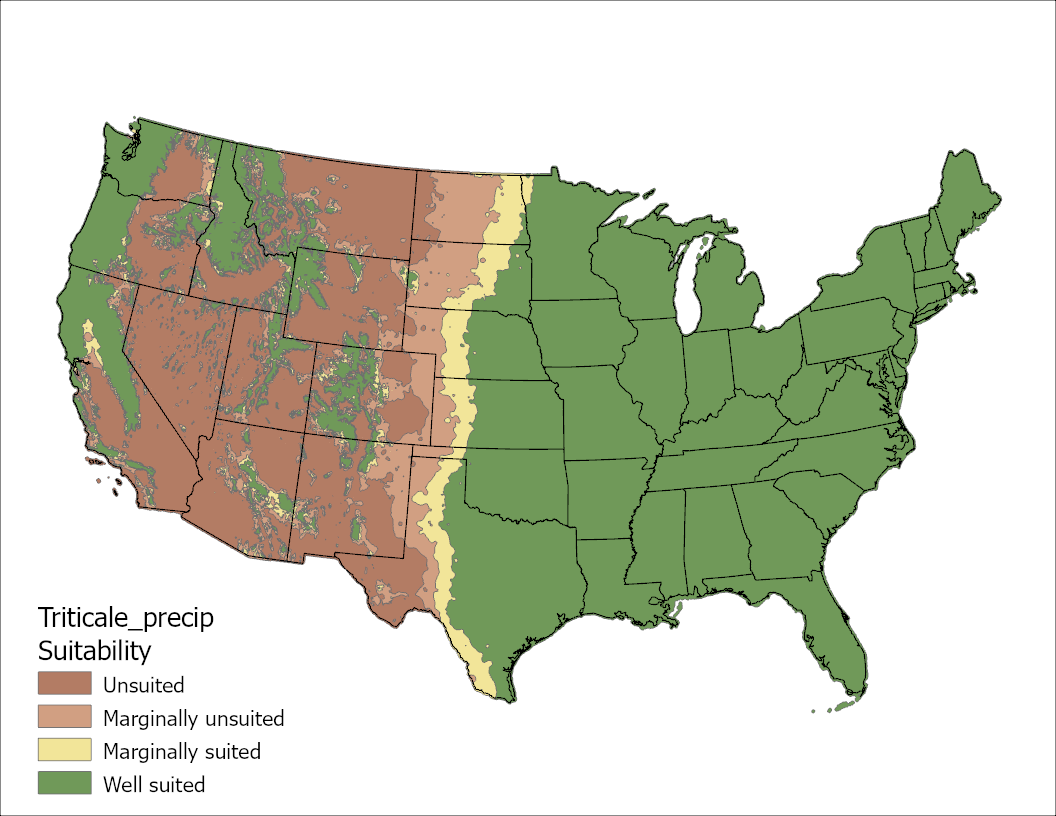
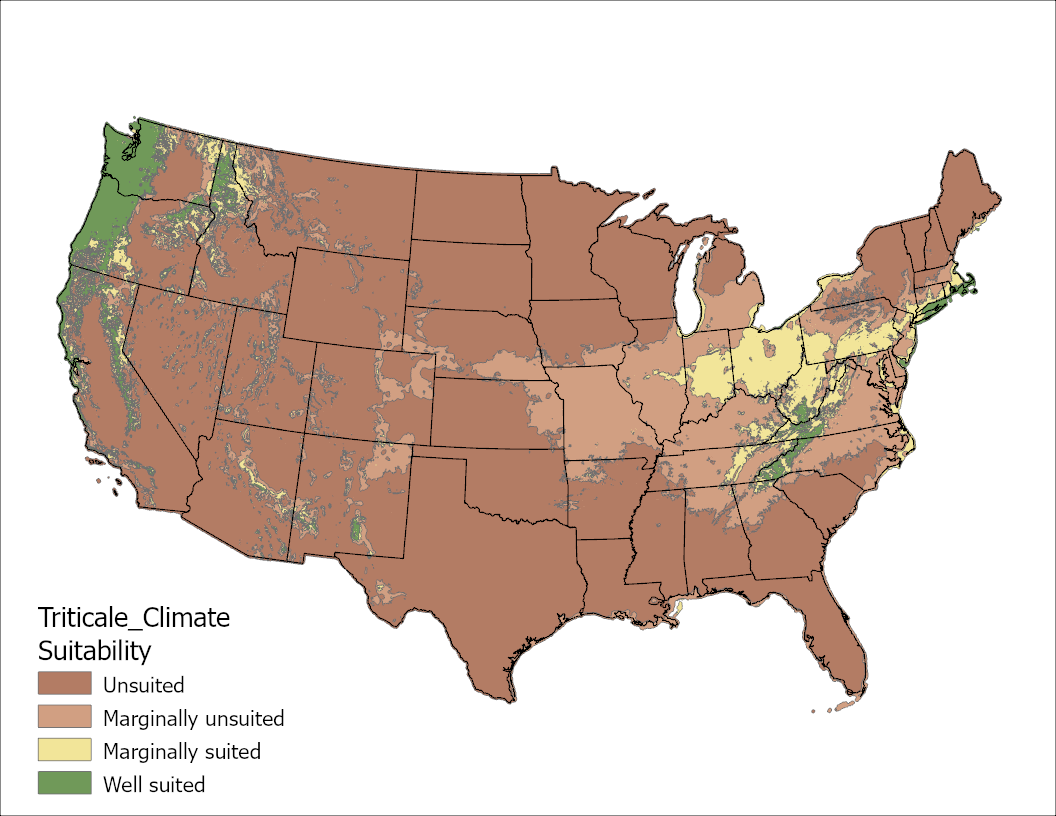
Based on literature and expert triticale specialist counsel, climatic and soil tolerances were compiled. Nine maps were created for winter triticale, one for each of 3 climate factors and one for each of the soil factors, one combined climate factors map, one combine soil factors map, and a map for all of the factors combined. This allows for each factor to be examined and addressed to improve suitability through management. Small images of maps are provided below, with larger maps linked by clicking. For spring barley, all factors except for Tmin values would be the same.
The Contiguous USA
|
Climate Factors |
Soil Factors |
All Factors Combined |
|
Minimum Temperature Image
|
pH Image

|
Climate and Soil Image

|
|
Maximum Temperature Image

|
Drainage Image

|
All Soil Image

|
|
Precipitation Image
|
Salinity Image

|
Climate Image
|
Click on the thumbnail image to view a larger map.
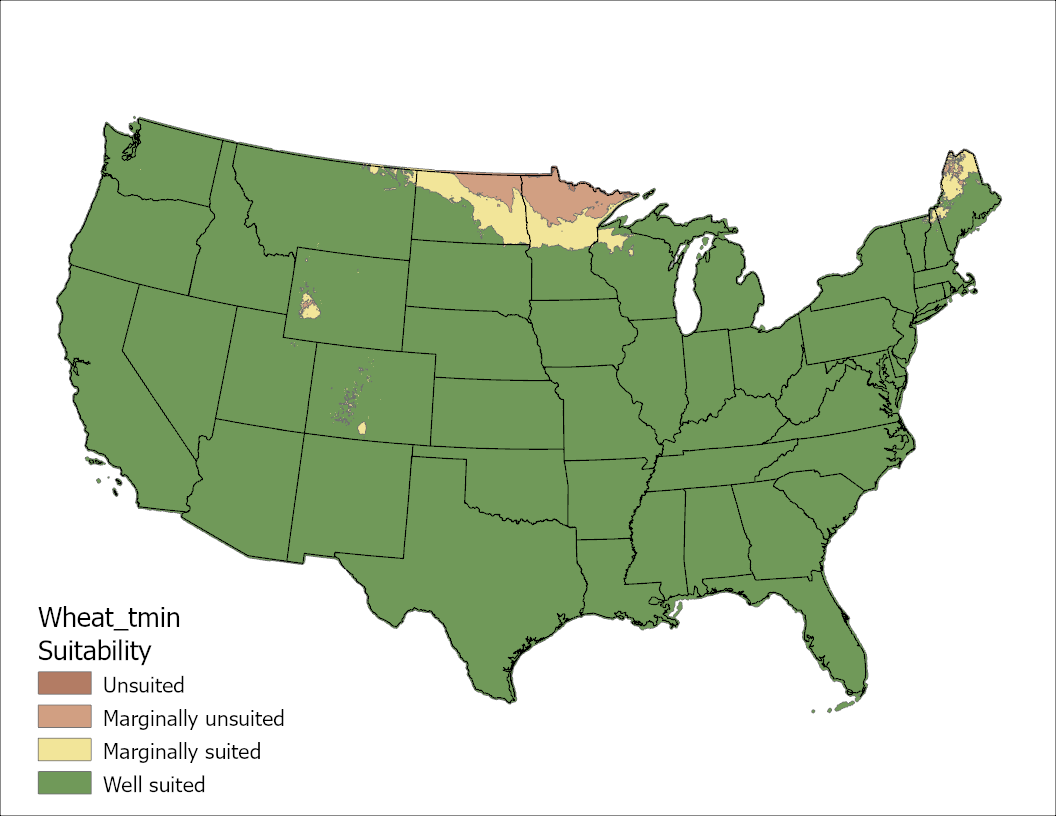
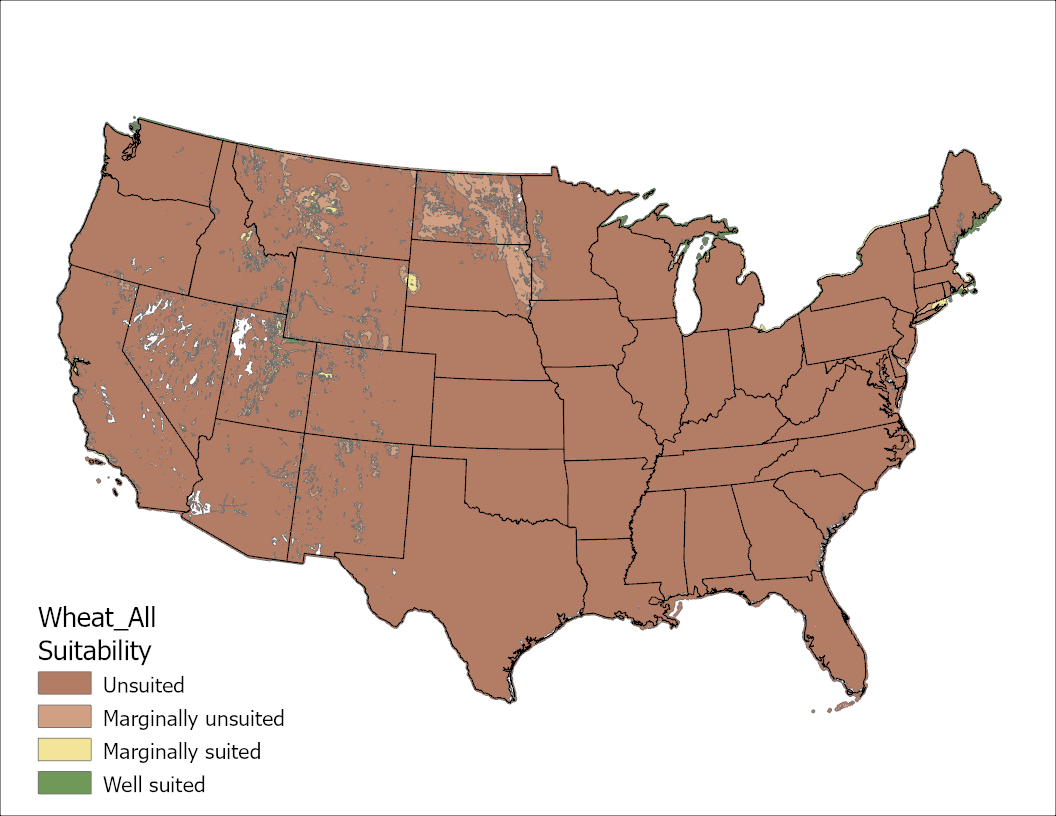
Based on literature and expert wheat specialist counsel, climatic and soil tolerances were compiled. Nine maps were created for winter wheat, one for each of 3 climate factors and one for each of the soil factors, one combined climate factors map, one combined soil factors map, and a map for all of the factors combined. This allows for each factor to be examined and addressed to improve suitability through management. Small images of maps are provided below, with larger maps linked by clicking. For spring wheat, all factors except for Tmin values would be the same.
The Contiguous USA
|
Climate Factors |
Soil Factors | All Factors Combined |
|---|---|---|
|
Minimum Temperature Image
|
pH Image

|
Climate and Soil Image
|
|
Maximum Temperature Image

|
Drainage Image
|
All Soil Image

|
|
Precipitation Image
|
Salinity Image

|
Climate Image
|
Click on the thumbnail image to view a larger map.
Legume
Defining the regions within the USA where the various fall dormancy (FD) and winter survival index (WSI) alfalfa cultivar types can be successfully used is an important marketing and management application of GIS technologies. These maps provide a guide for cultivar selection decisions and for identifying areas for conducting further field evaluations to validate and/or revise these maps.
Low winter temperatures limit the northern range of the FD and WSI types, while other climate and soil factors also combine to define optimal cultivar characteristics.
Agronomic field trials have been the standard evaluation technique for selecting cultivars, but extrapolation of information from one site to another for these types of trials has always been problematic. By developing suitability zone maps, based on our best knowledge of cultivar characteristics, field-based evaluation can make more efficient use of available testing resources. Using these techniques and technologies, the limited number of field trials can be extended across the USA and contribute to the global suitability information contained in the quantitative tolerances tables and function.
Drop-down menu for Fall Dormancy Level
Drop-down menu for Winter Survival Index
Climate
Jan Tmin
Jul Tmax
Ann Precipitation
Combined
Soil
pH
Drainage
Salinity
Combined
Climate and Soil Combined
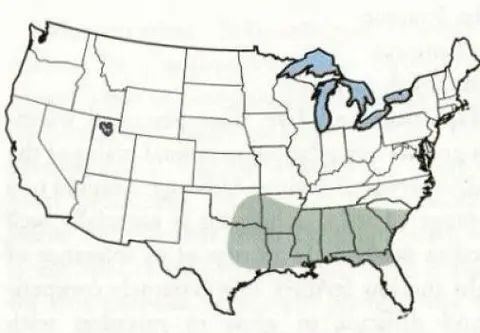
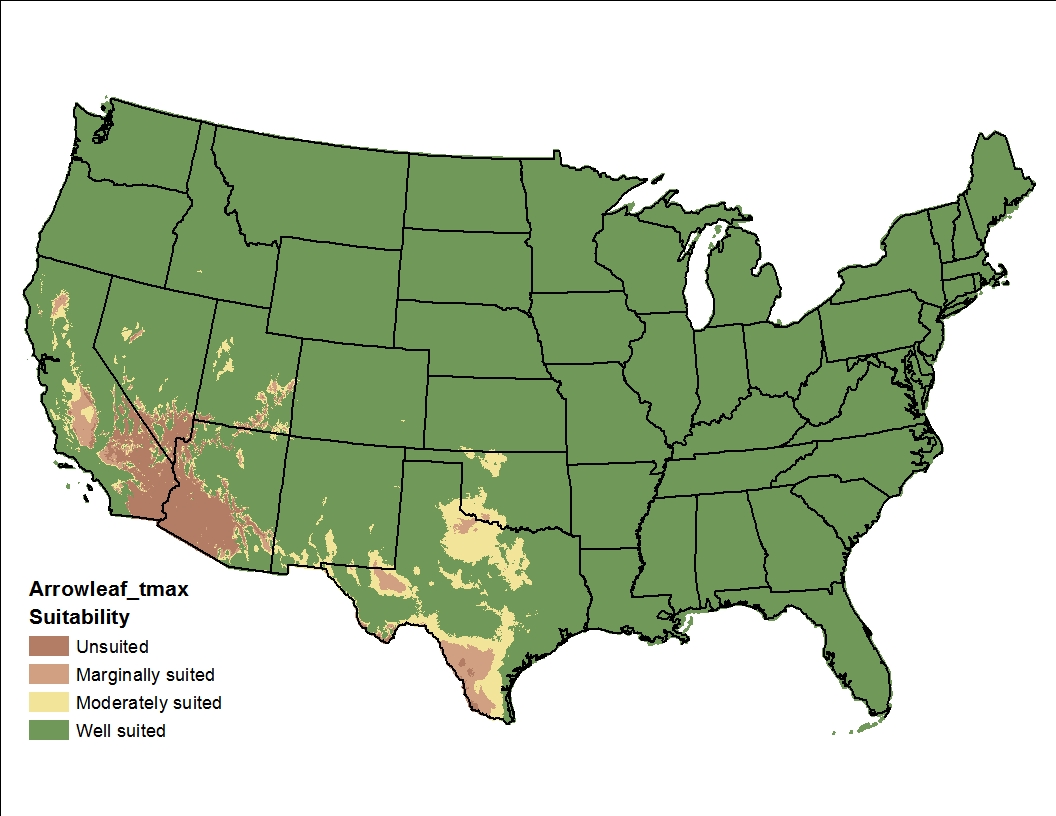
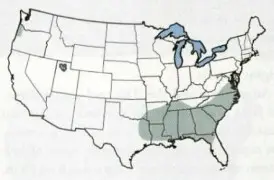
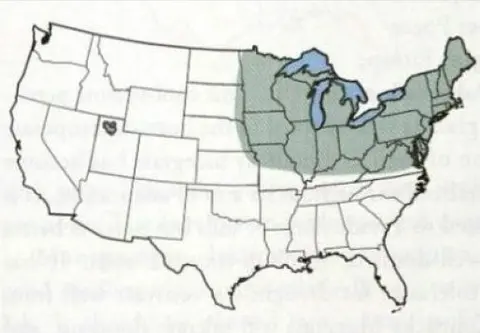
Historically, maps have been drawn based on primary use areas, showing broad geographic areas, e.g. Compendium of Common Forages maps within Forages: An Introduction to Grassland Agriculture, 7th ed. (2018), John Wiley & Sons, Inc.
(Alsike clover generalized adaptation and common use map.)
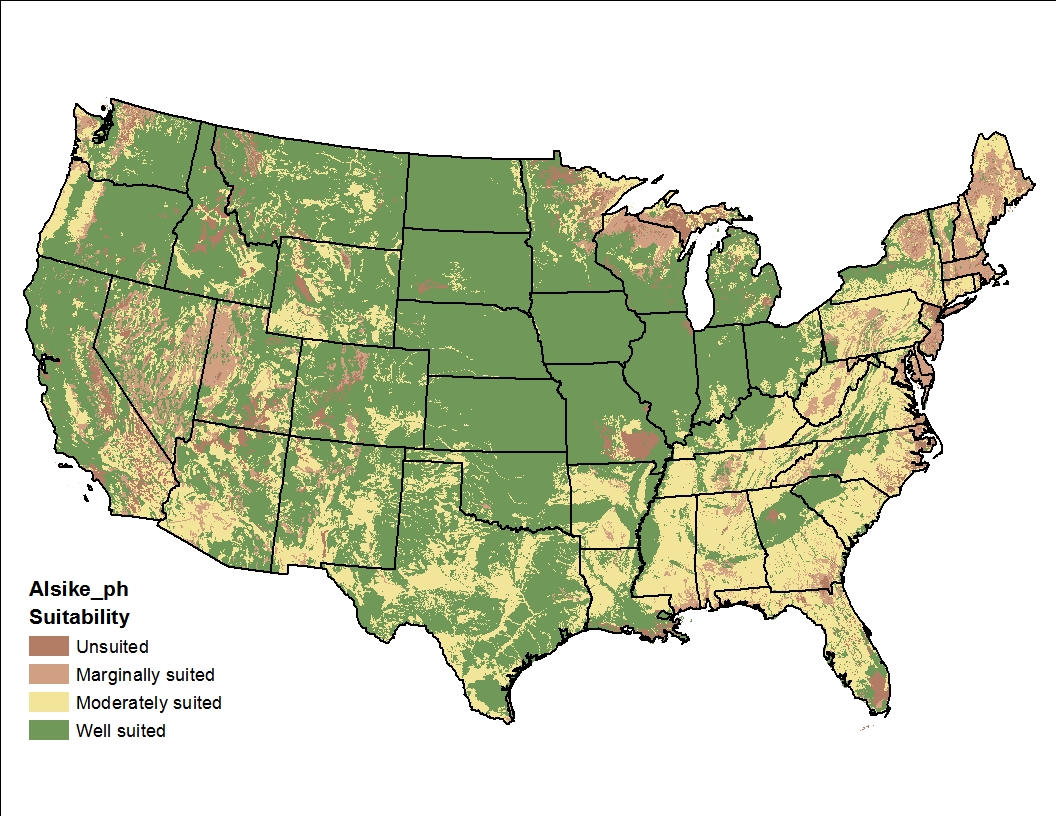
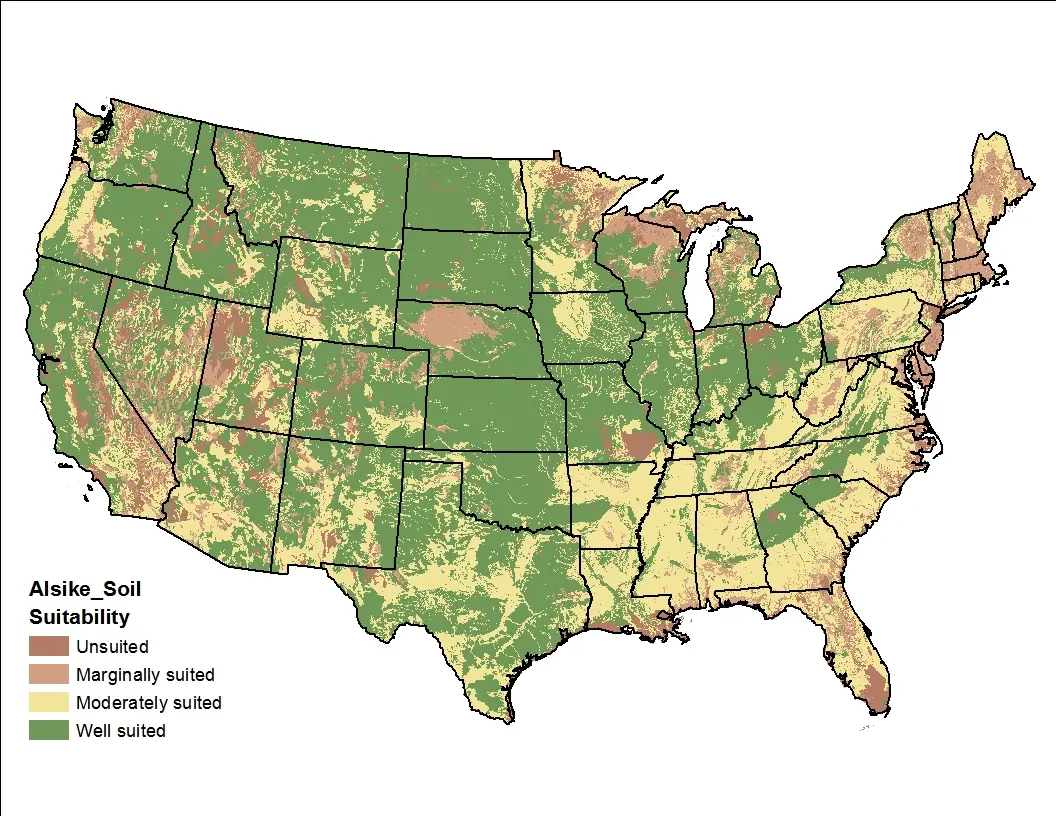
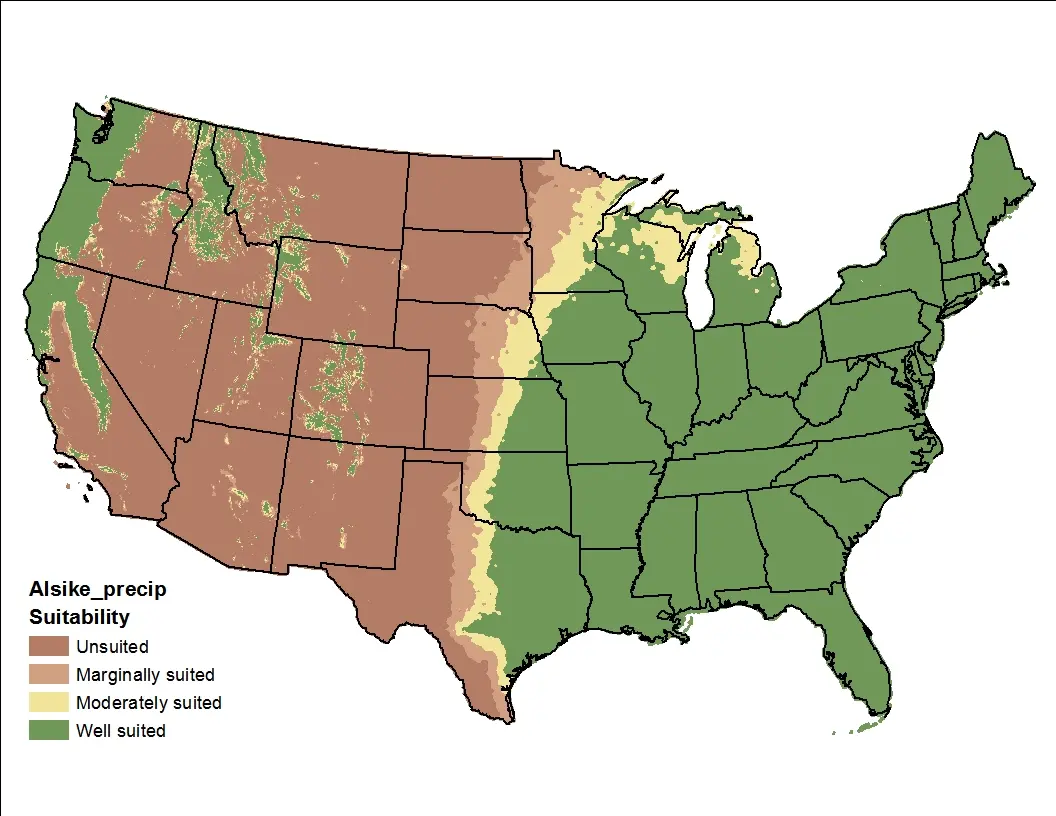
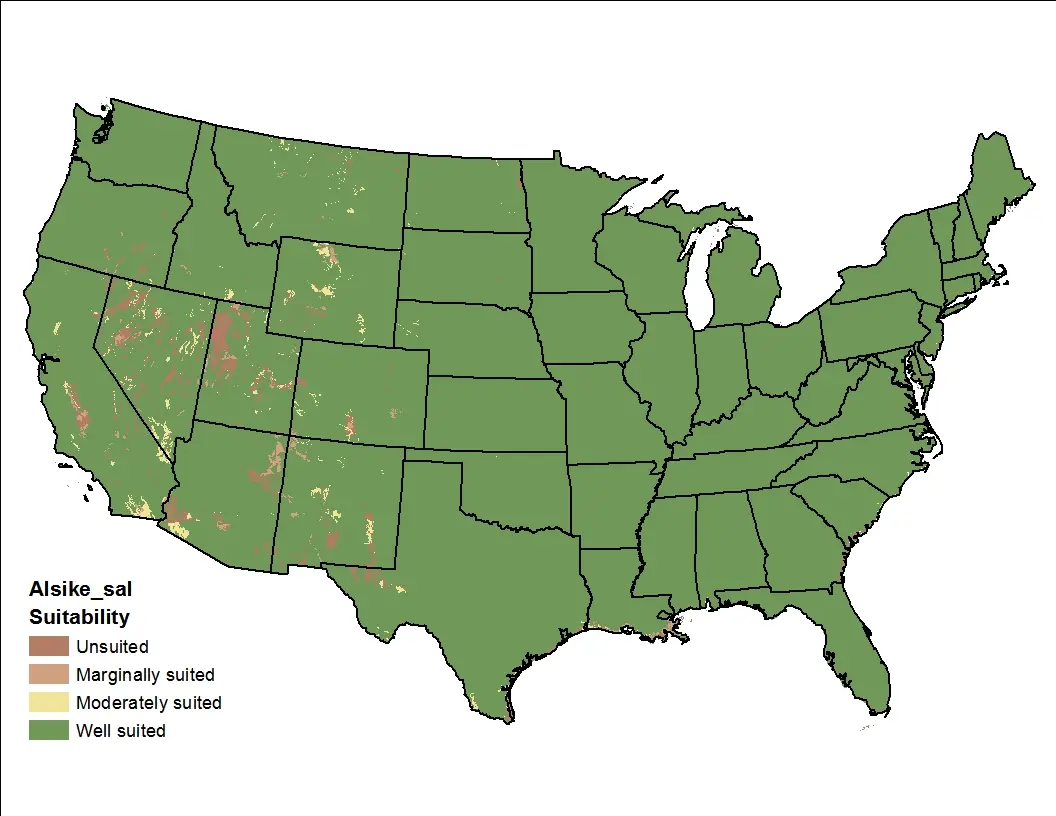
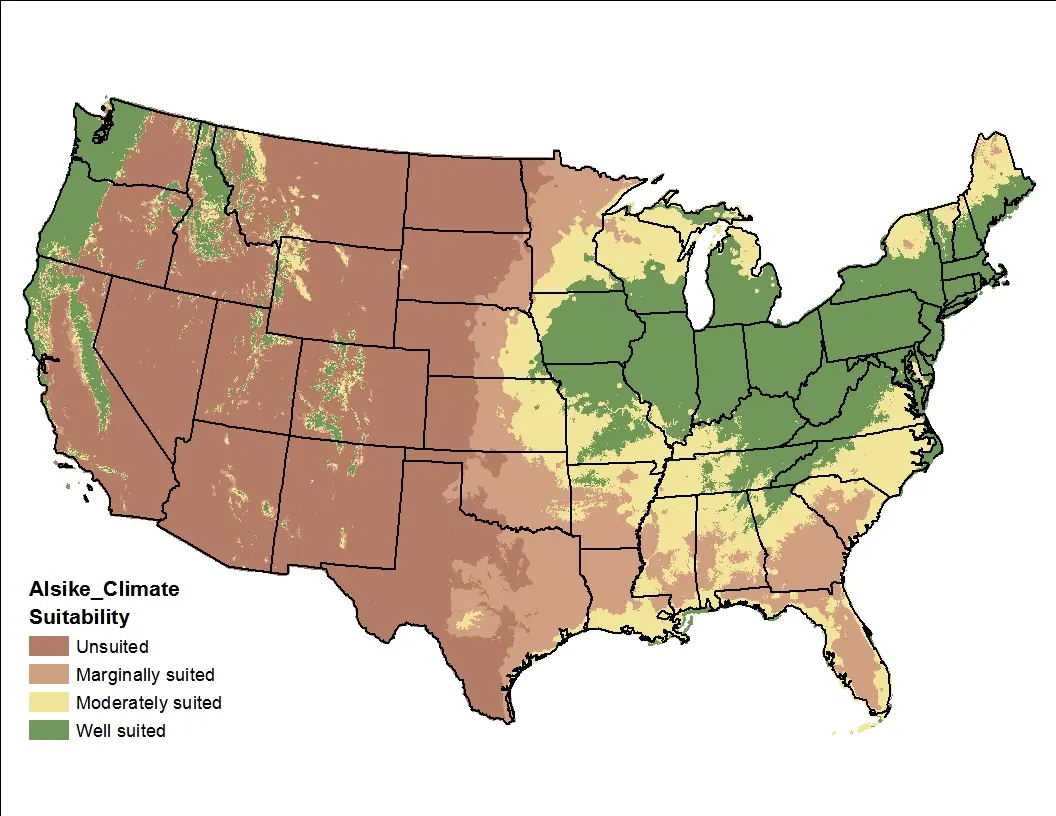
More highly detailed maps, based on quantitative climatic and soil factor tolerances and using GIS spatial grids, provide information on where species are suitable for a variety of intended uses.
The following collection of maps were developed by a group of Oregon State University scientists, using the PRISM-generated collection of climate factor grids and the NRCS soil characteristics database. The procedure used to produce these suitability maps is described below.
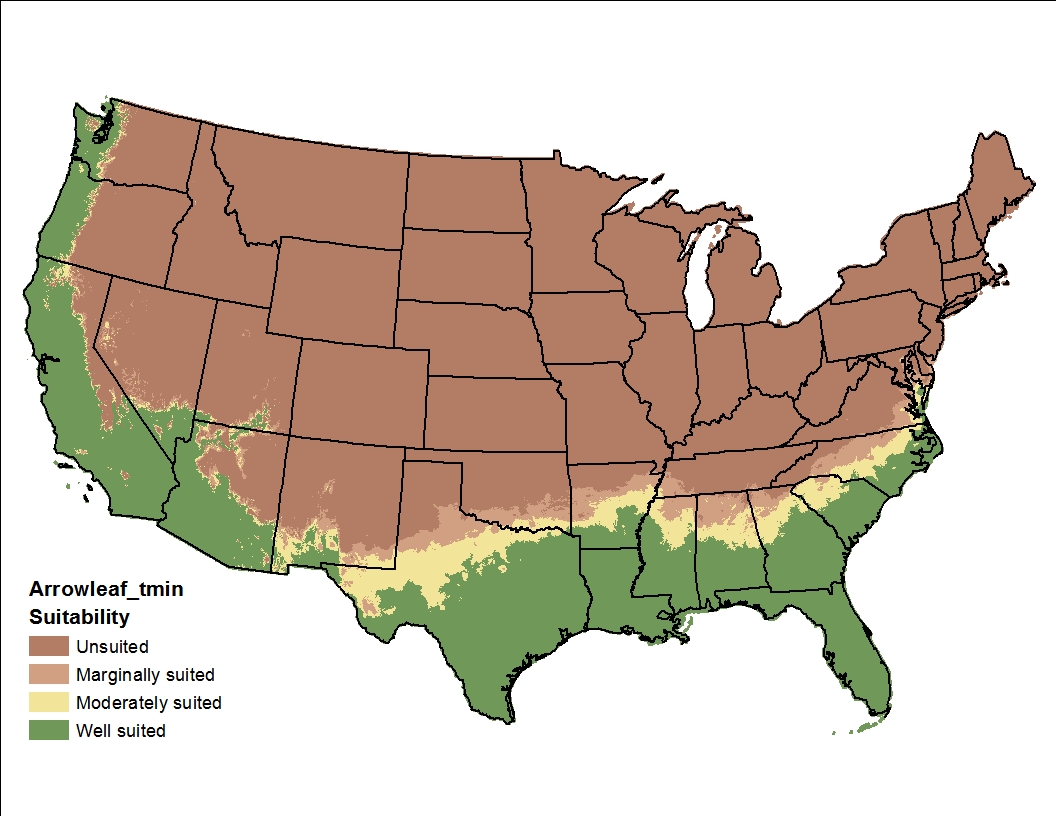
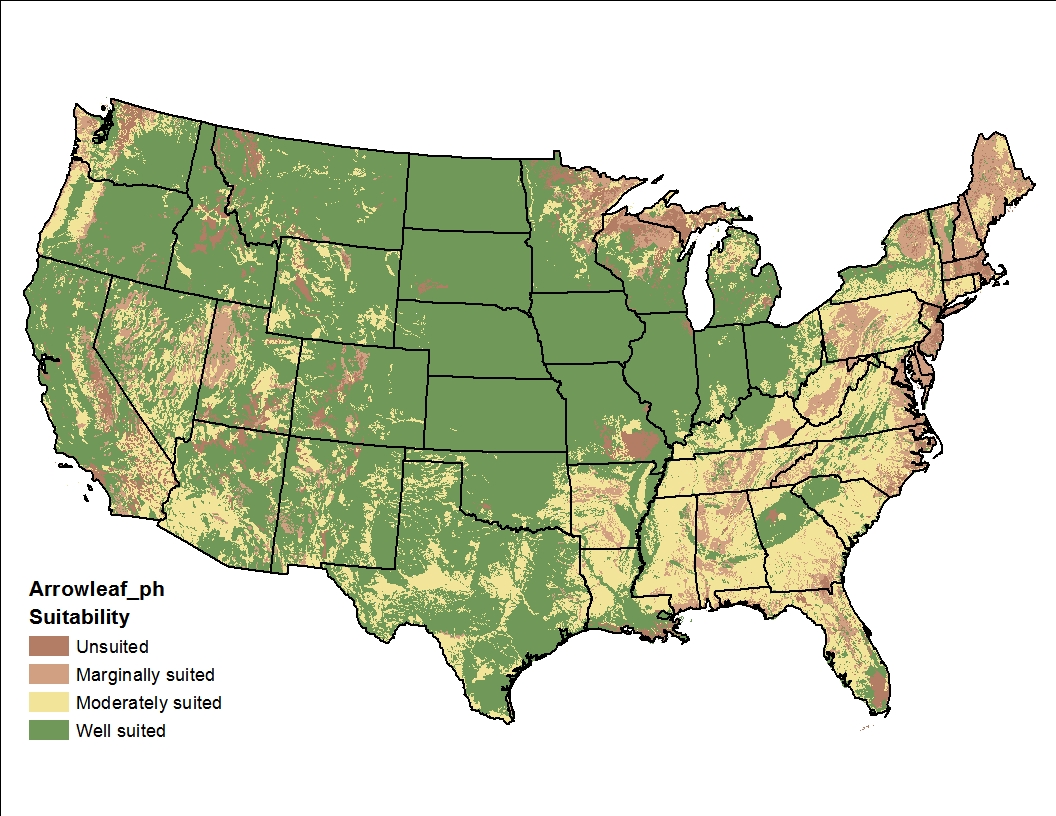
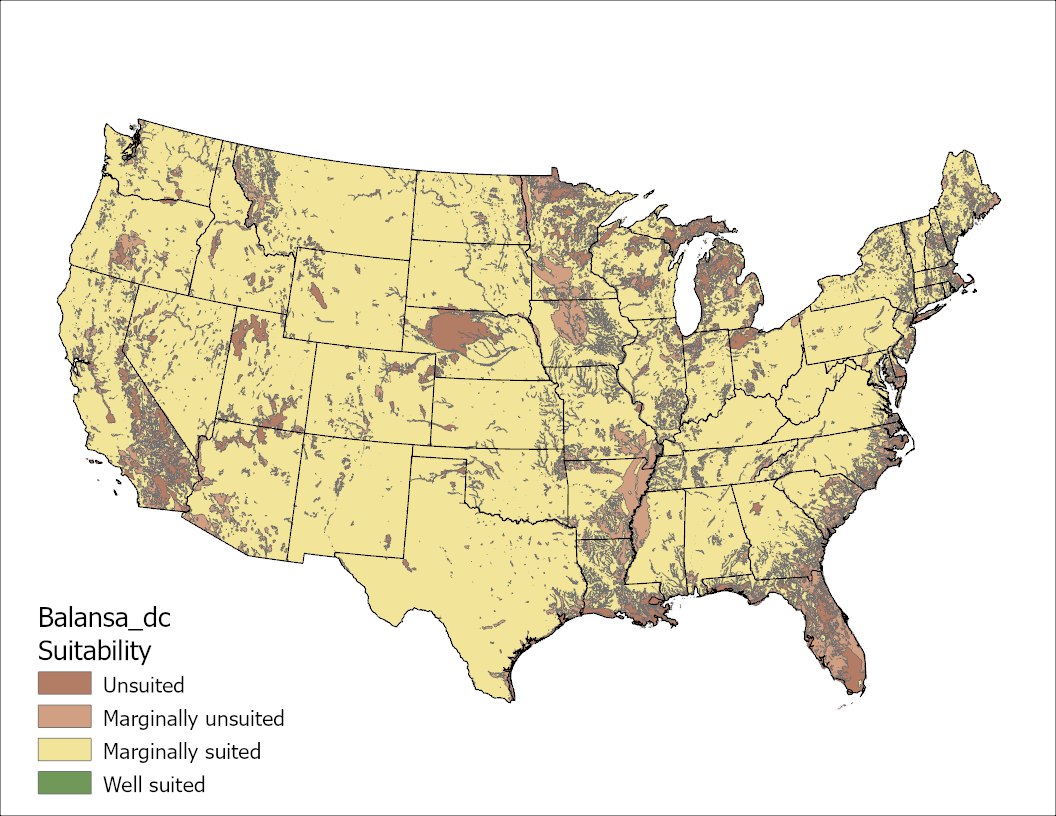
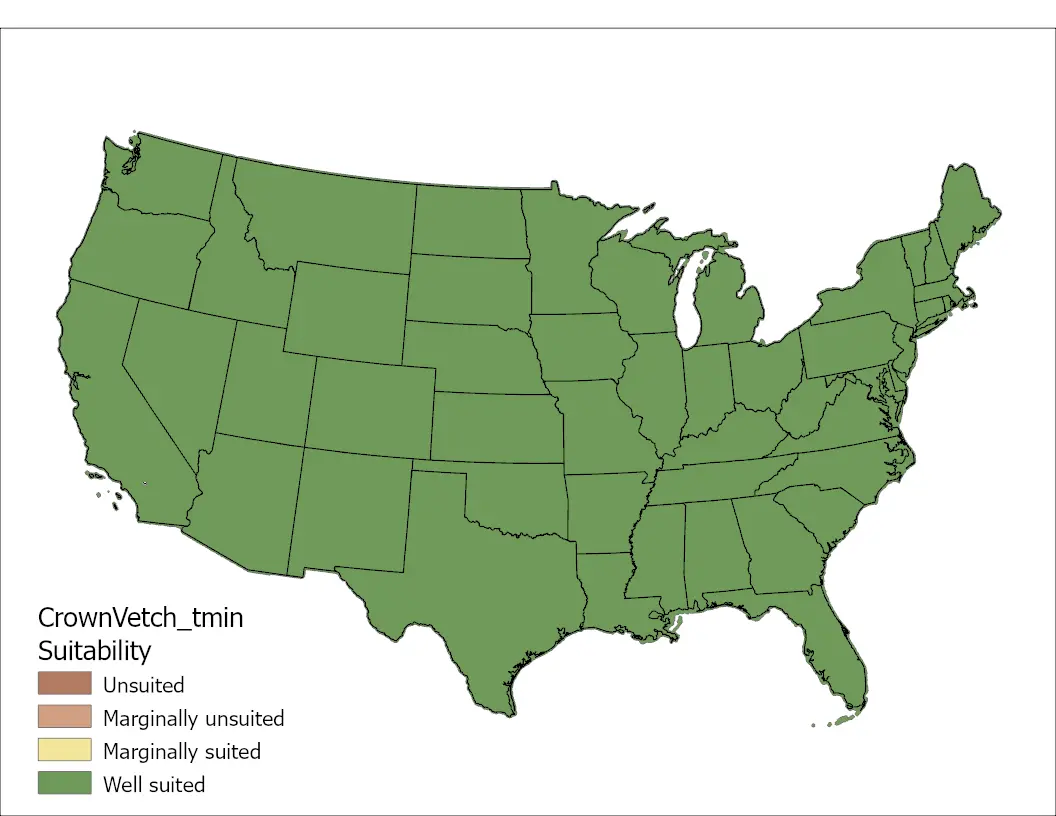
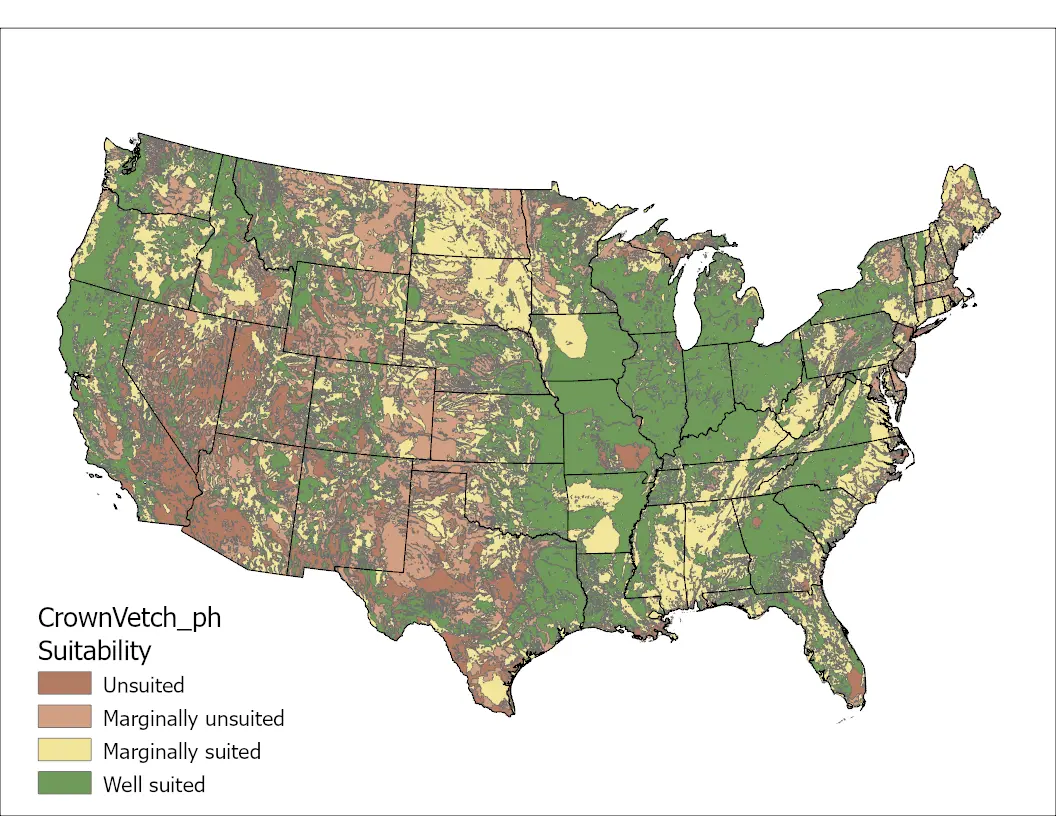
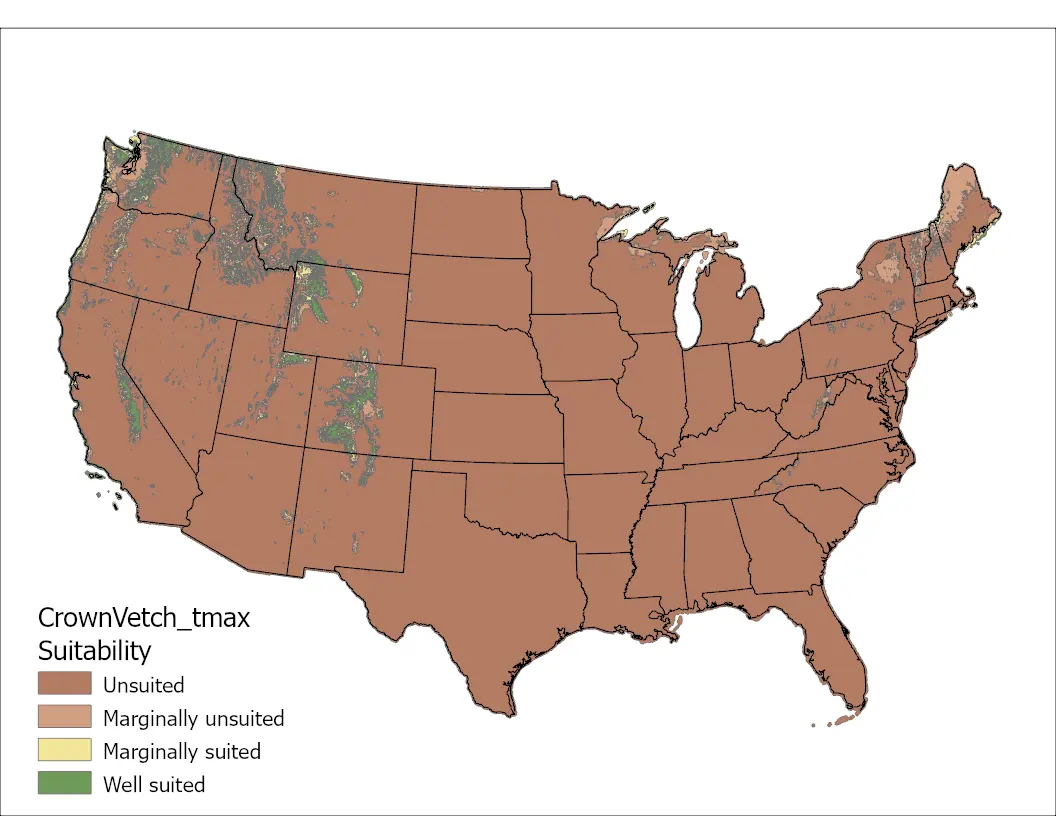
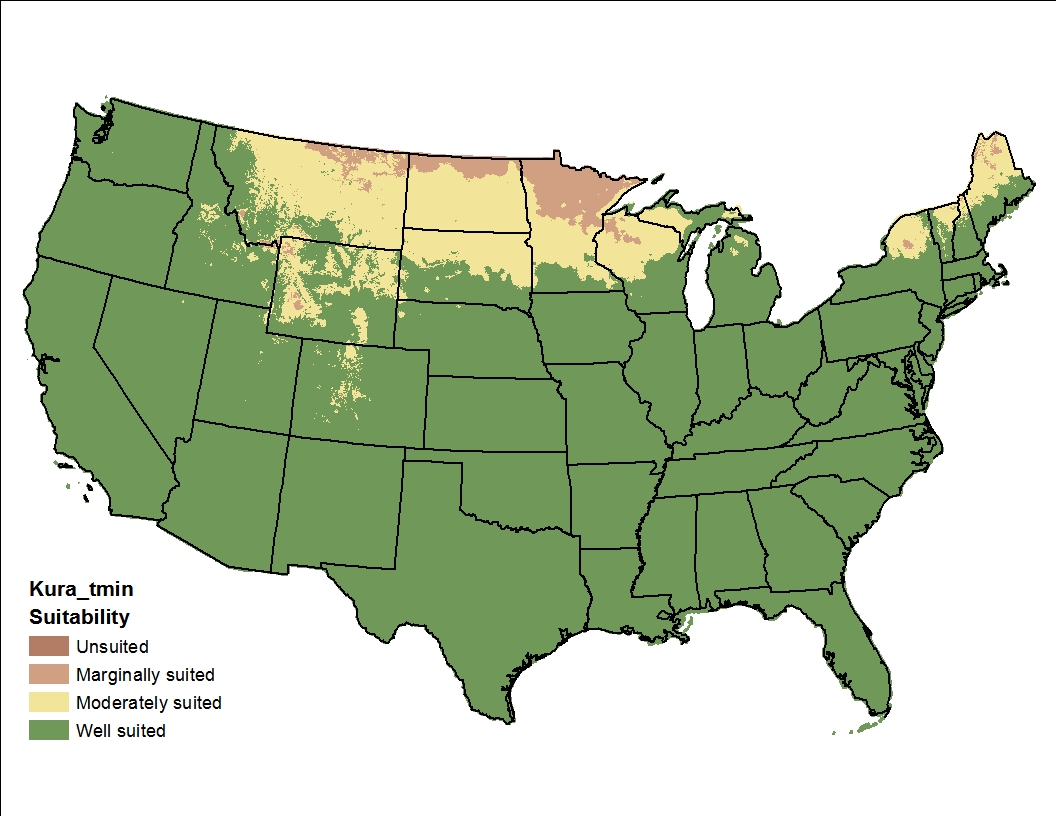
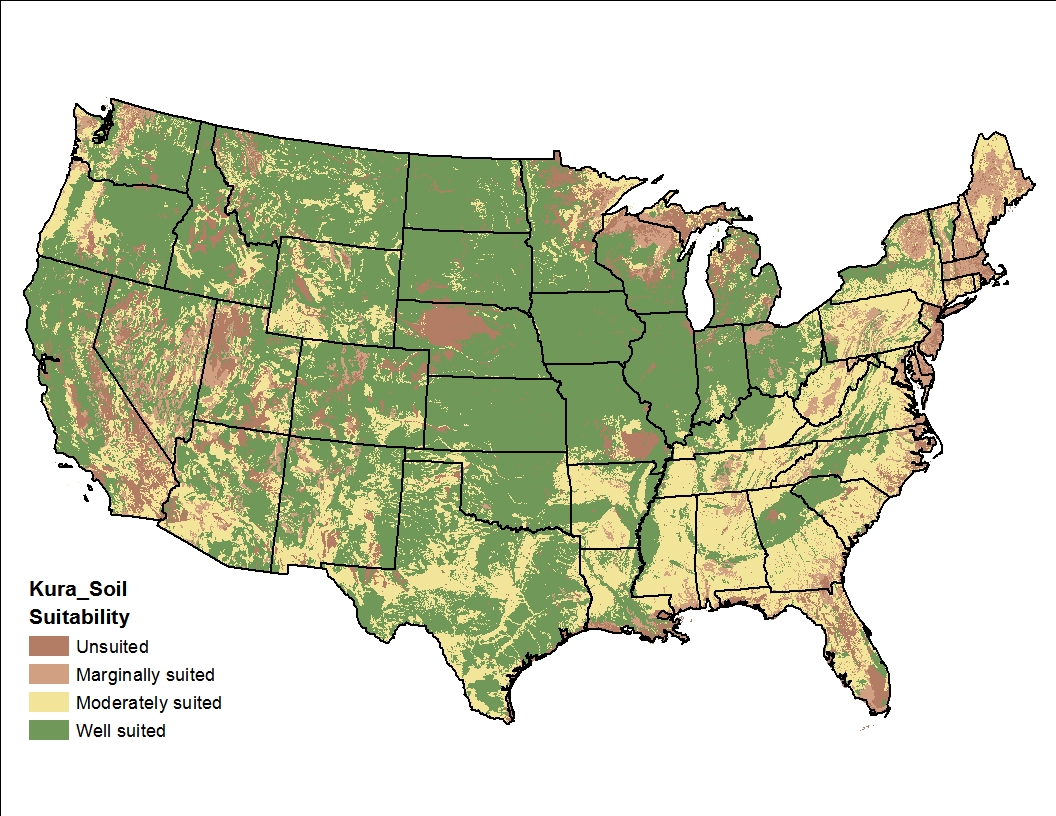
Suitability curves were developed for each clover species for three climate variables (average annual precipitation, average July maximum temperature, and average annual extreme low temperature) and three soil variables (drainage class, pH, and salinity). For each variable and each species, the curves were fit using estimated yield data across the full range of values for the given variable.
The coefficients for the model equations were applied to spatial data layers representing each climate and soil variable, resulting in spatial outputs of percent yield for each of the clover species and each climate and soil variable. The percent yield layers were then classified into four suitability classes, as follows:
100%-75% - Suitable
75%-50% - Moderately suitable
50%-25% - Marginally suitable
25-0% - Not suitable
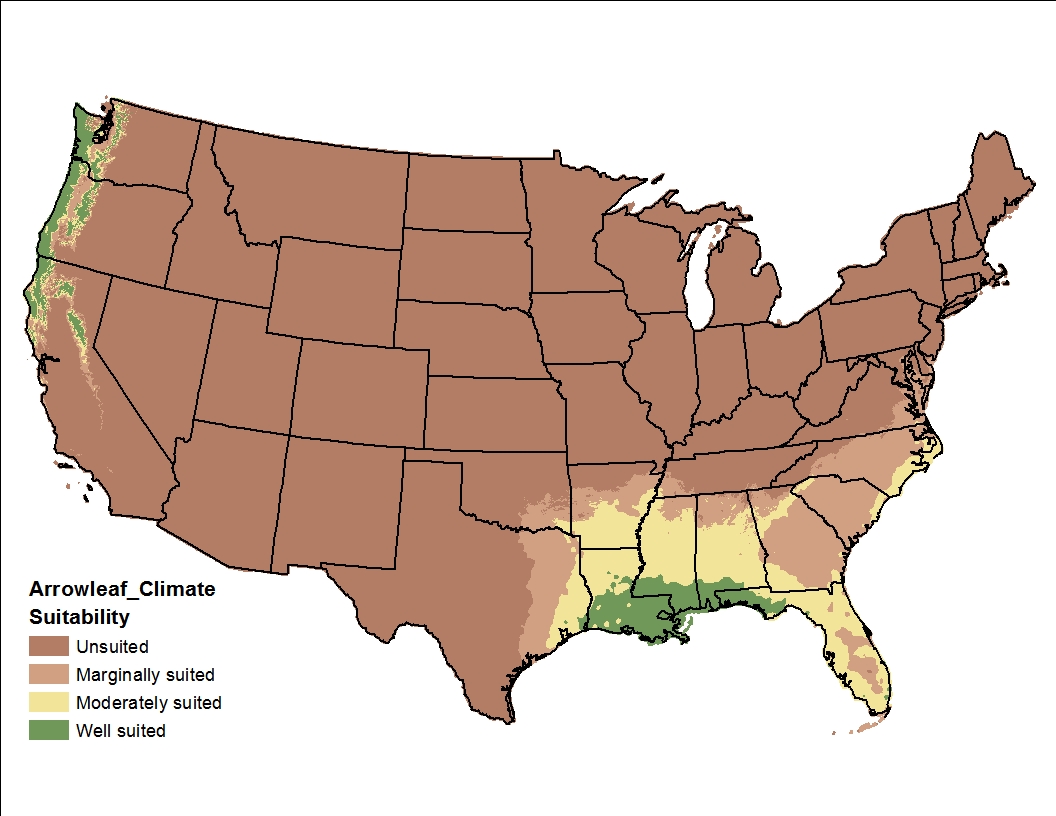
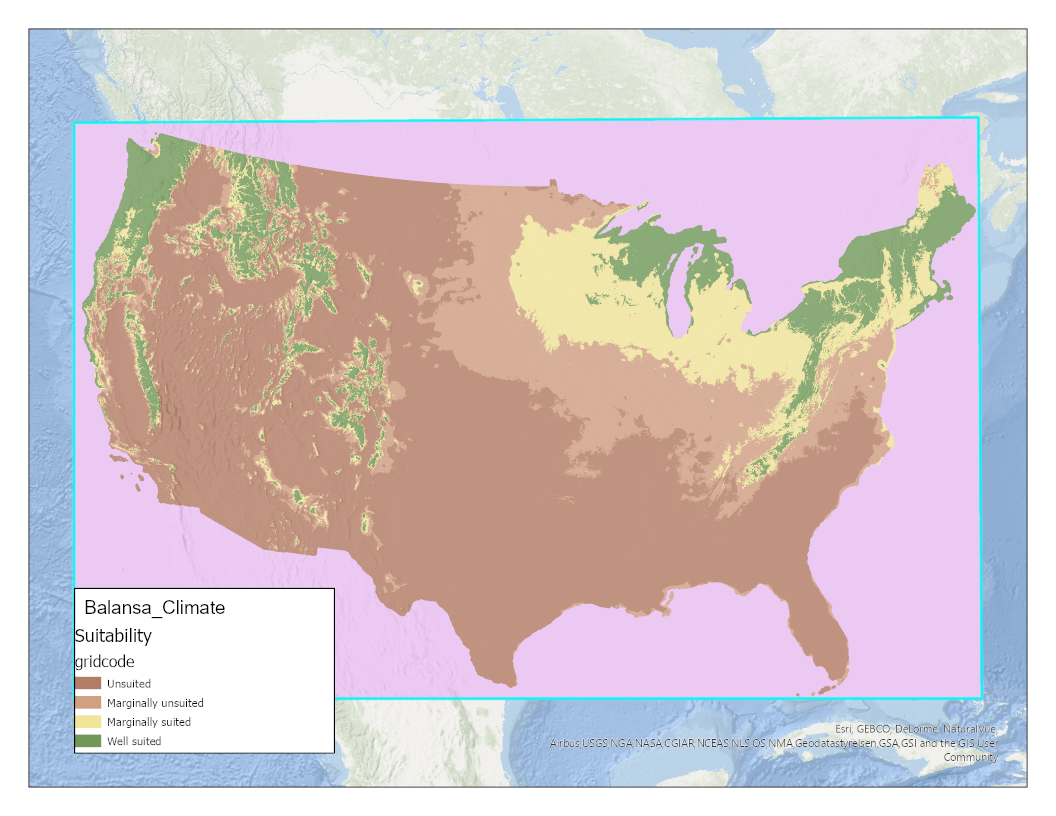
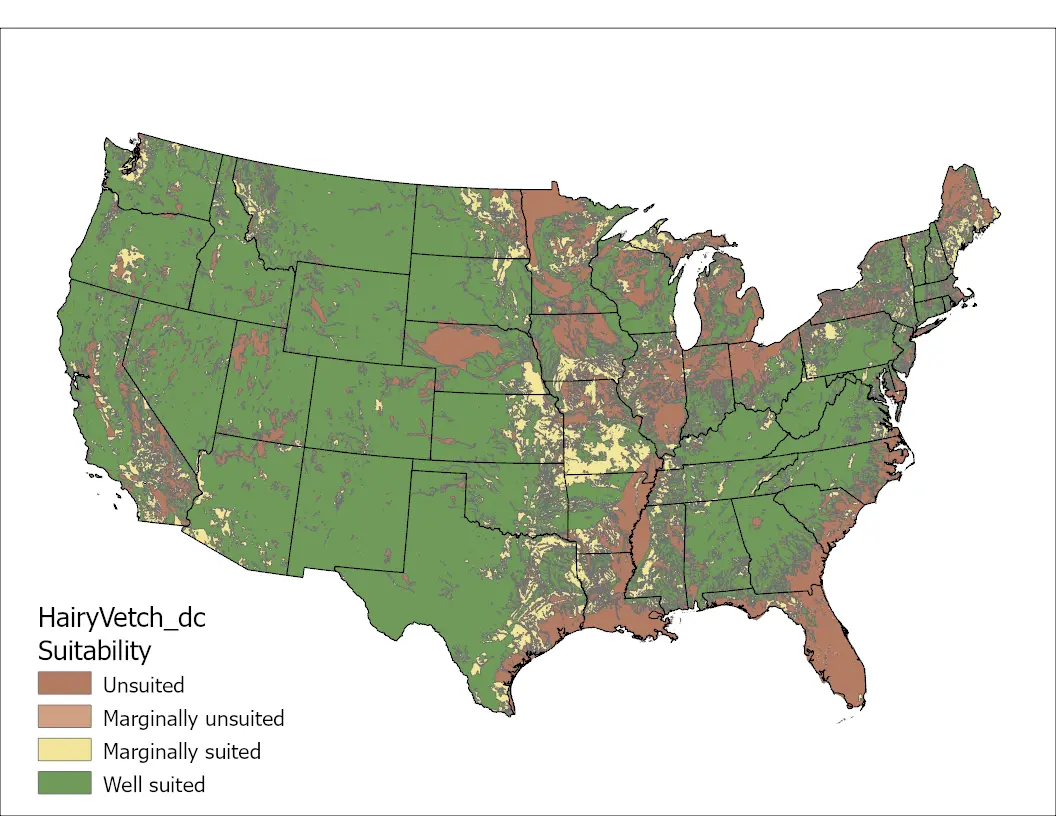
Finally, three "hybrid" suitability layers were produced for each clover species based on combinations of 1) the three climate variables, 2) the three soil variables, and 3) all six climate and soil variables together. These combined suitability layers were created by selecting for each location the lowest suitability value of the included variables, with the idea that the overall suitability for a species will be limited by the most restrictive factor.
Data sources
----------------
Climate data: 800m PRISM 30-year normals for years 1981-2010 (PRISM Climate Group, Oregon State University, accessed 2018-01-17)
Soils data: NRCS STATSGO (Soil Survey Staff, Natural Resources Conservation Service, United States Department of Agriculture. U.S. General Soil Map (STATSGO2). Available online. Accessed 2018-01-10)
Quantitative Tolerances GIS-based Maps
The Contiguous USA
| Climate Factors | Soil Factors | Combined Factors |
|---|---|---|
|
Minimum Temperature Image

|
pH Image
|
Climate and Soil Image

|
|
Maximum Temperature Image
|
Drainage Image

|
All Soil Image
|
|
Precipitation Image
|
Salinity Image
|
All Climate Image
|
Click on the thumbnail image to view a larger map.
State Maps
Hawaii
| Climate Factors | Soil Factors | Combined Factors |
|
Minimum temperature Image

|
pH Image

|
Climate and Soil Image

|
|
Maximum temperature Image

|
Drainage Image

|
All Soil Image

|
|
Precipitation Image

|
Salinity Image

|
All Climate Image

|
Oregon


Historically, maps have been drawn based on primary use areas, showing broad geographic areas, e.g. Compendium of Common Forages maps within Forages: An Introduction to Grassland Agriculture, 7th ed. (2018), John Wiley & Sons, Inc.
More highly detailed maps, based on quantitative climatic and soil factor tolerances and using GIS spatial grids, provide information on where species are suitable for a variety of intended uses.
The following collection of maps were developed by a group of Oregon State University scientists, using the PRISM-generated collection of climate factor grids and the NRCS soil characteristics database. The procedure used to produce these suitability maps is described below.
Suitability curves were developed for each clover species for three climate variables (average annual precipitation, average July maximum temperature, and average annual extreme low temperature) and three soil variables (drainage class, pH, and salinity). For each variable and each species, the curves were fit using estimated yield data across the full range of values for the given variable.
The coefficients for the model equations were applied to spatial data layers representing each climate and soil variable, resulting in spatial outputs of percent yield for each of the clover species and each climate and soil variable. The percent yield layers were then classified into four suitability classes, as follows:
| Classification | Relative Yield (RY) % |
|---|---|
| Unsuited | 0-25 |
| Marginally unsuited | 26-50 |
| Marginally suited | 51-74 |
| Well suited | 75-100 |
Finally, three "hybrid" suitability layers were produced for each clover species based on combinations of 1) the three climate variables, 2) the three soil variables, and 3) all six climate and soil variables together. These combined suitability layers were created by selecting for each location the lowest suitability value of the included variables, with the idea that the overall suitability for a species will be limited by the most restrictive factor.
Data sources
----------------
Climate data: 800m PRISM 30-year normals for years 1981-2010 (PRISM Climate Group, Oregon State University, http://prism.oregonstate.edu, accessed 2018-01-17)
Soils data: NRCS STATSGO (Soil Survey Staff, Natural Resources Conservation Service, United States Department of Agriculture. U.S. General Soil Map (STATSGO2). Available online at https://sdmdataaccess.sc.egov.usda.gov. Accessed 2018-01-10.
QUANTITATIVE TOLERANCES GIS-BASED MAPS
The Contiguous USA
|
Climate Factors |
Soil Factors |
Combined Factors |
|---|---|---|
|
Minimum Temperature Image
|
pH Image
|
All Climate and Soil Image

|
|
Maximum Temperature Image
|
Drainage Image

|
All Soil Image
|
|
Precipitation Image

|
Salinity Image

|
All Climate Image
|
Click on the thumbnail image to view a larger map.
State Maps
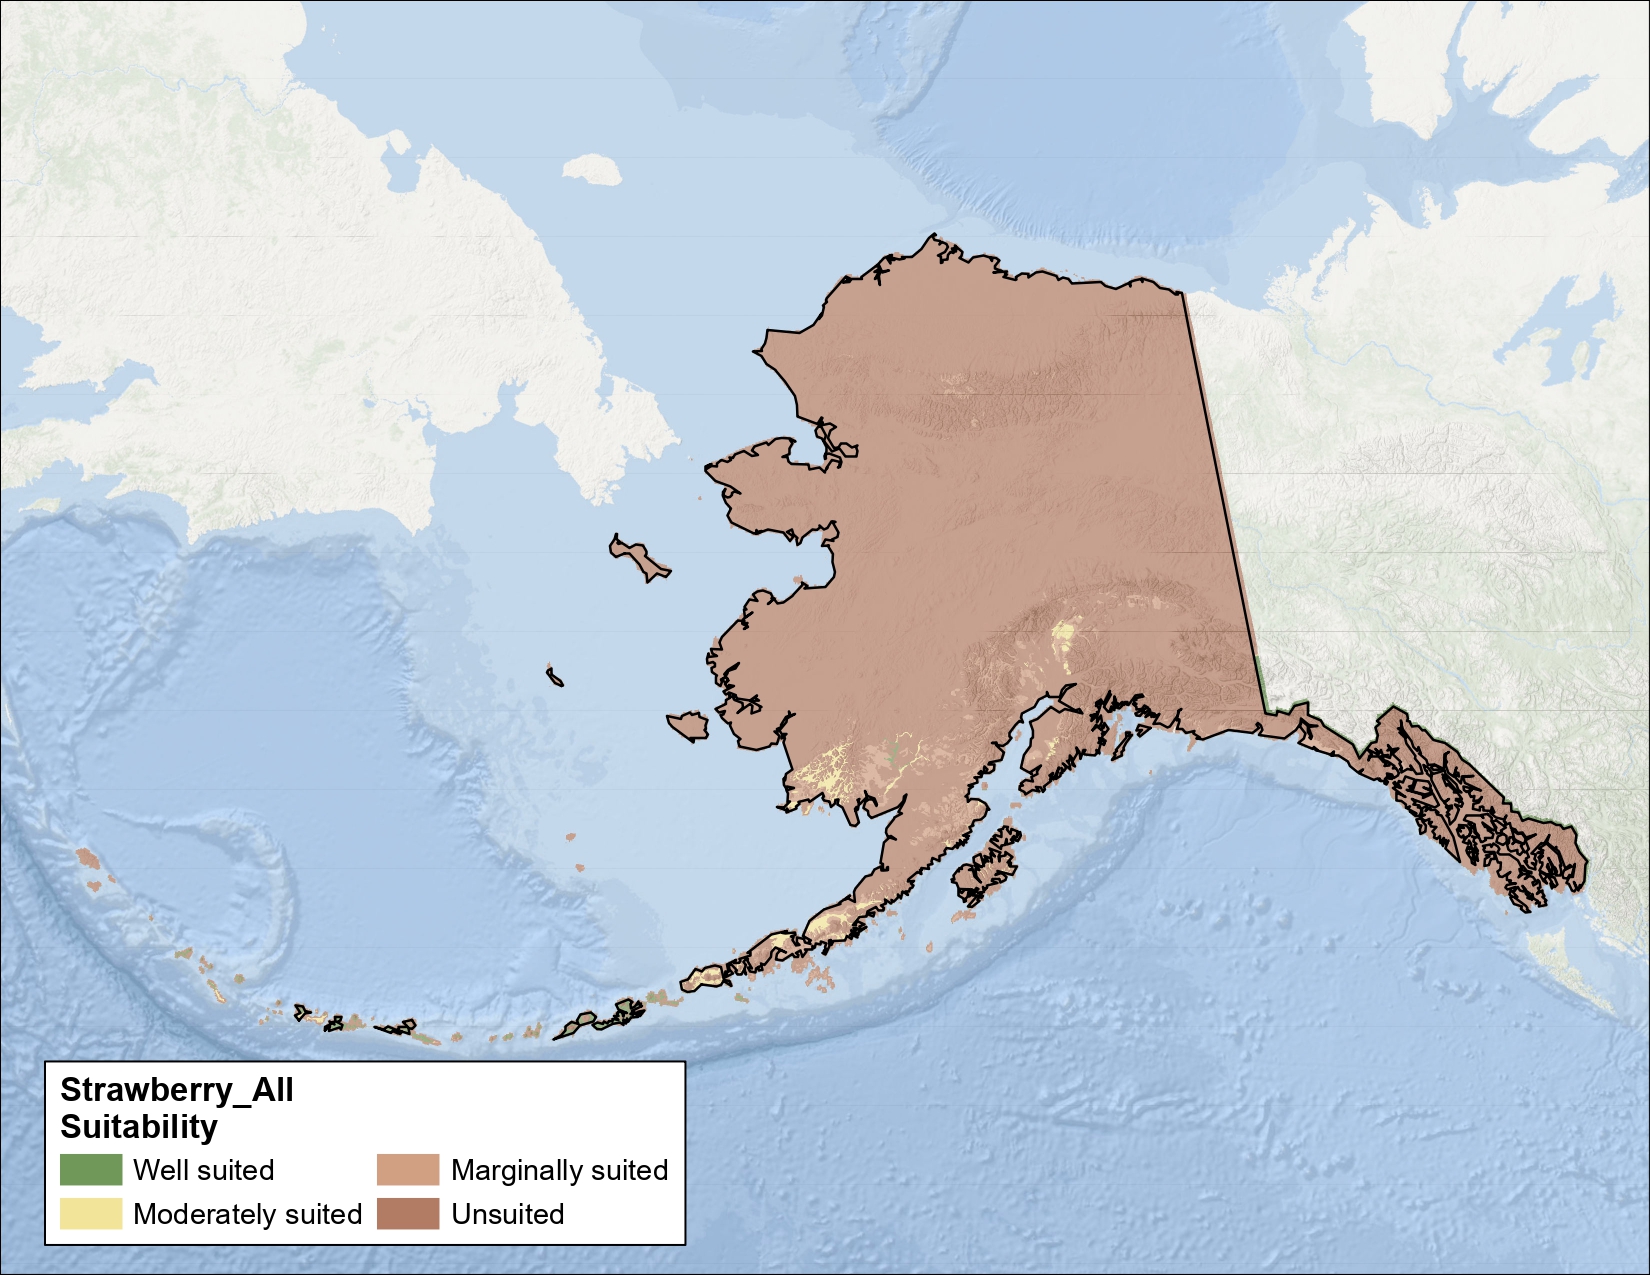
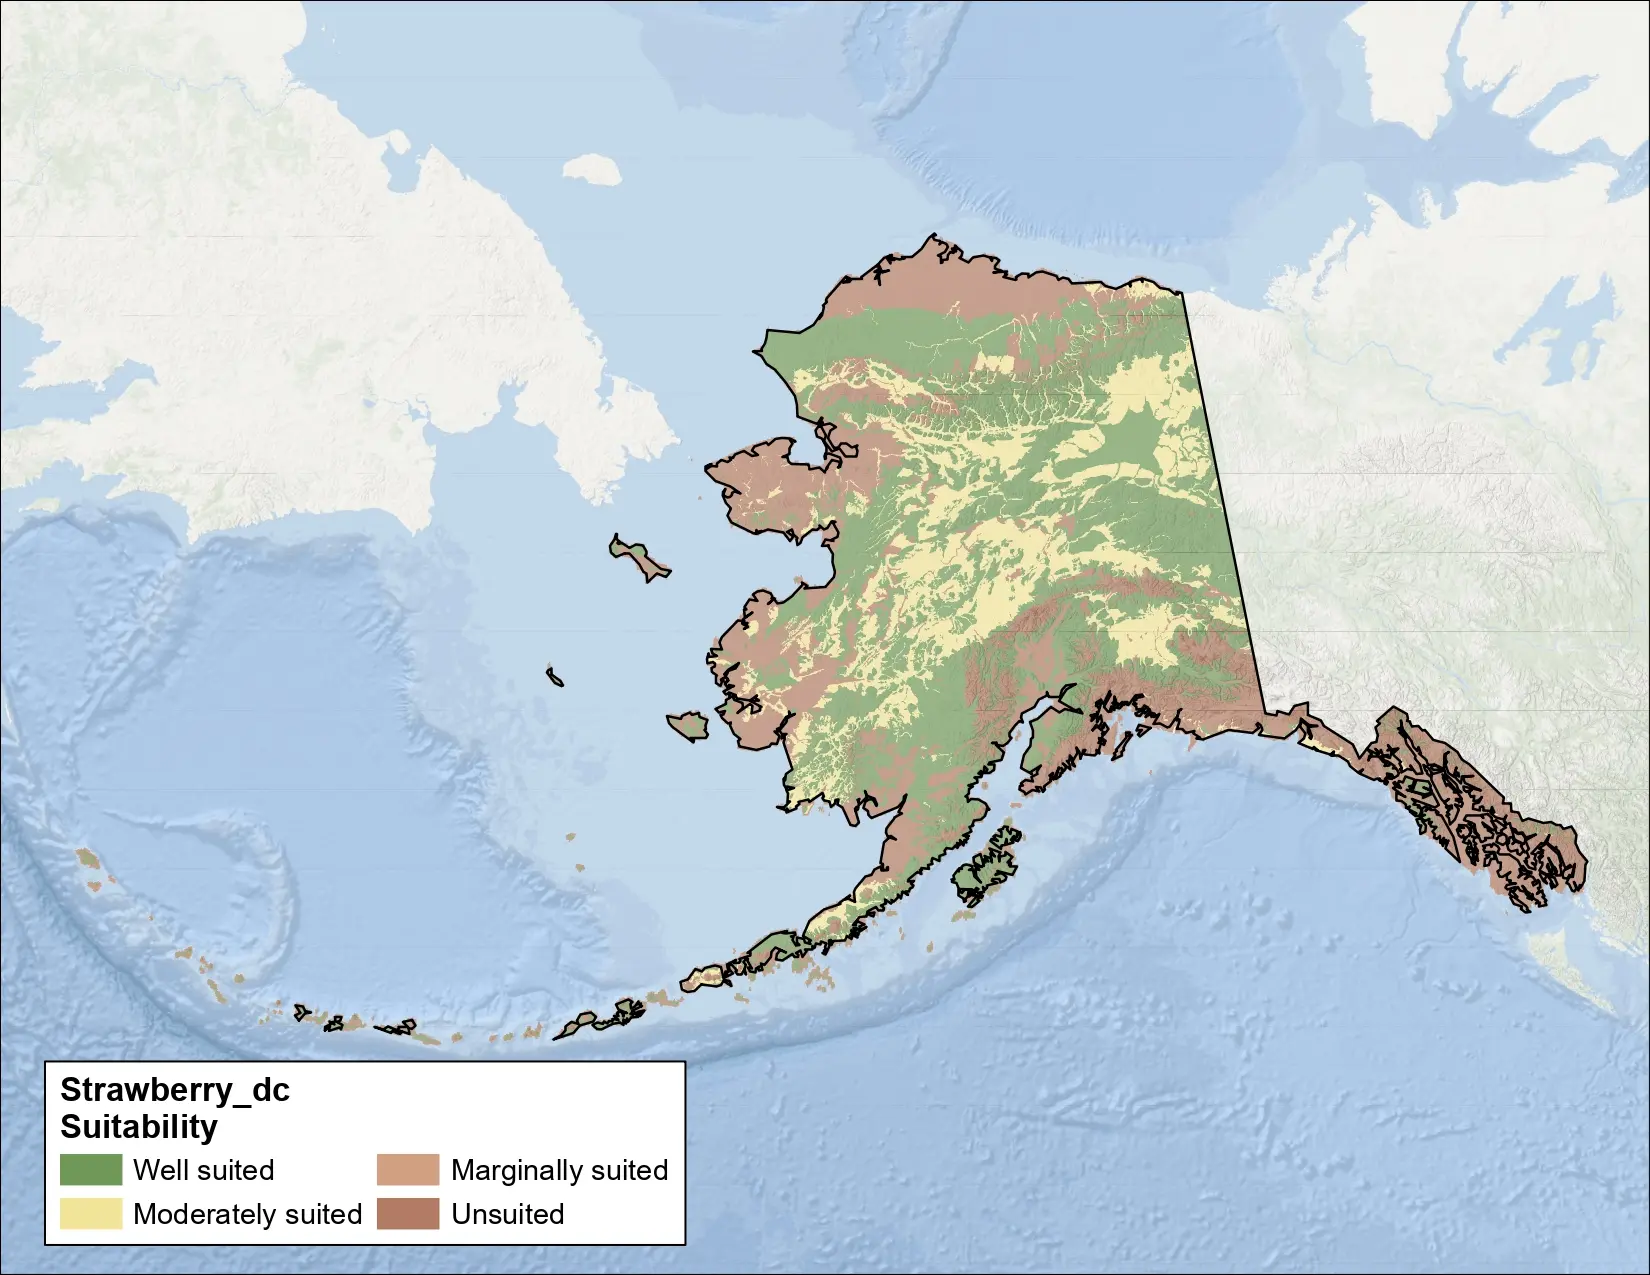
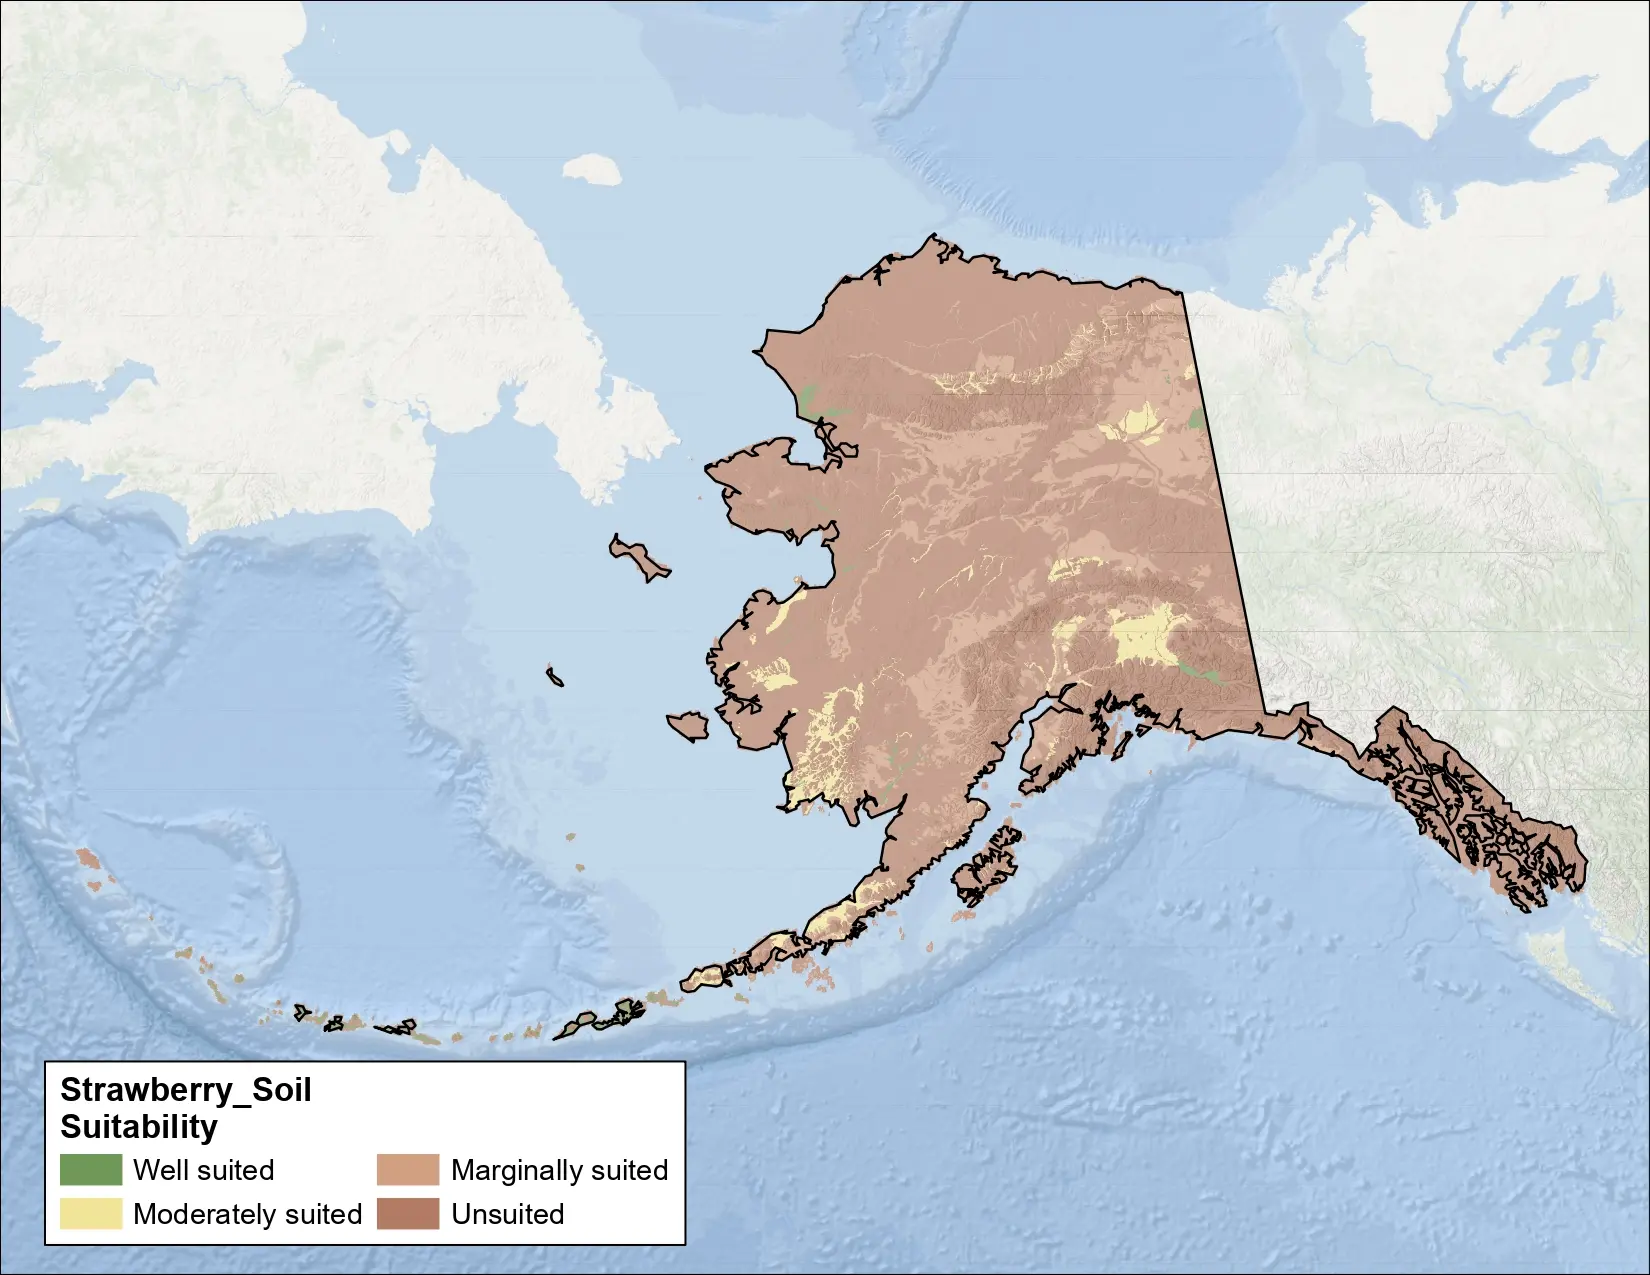
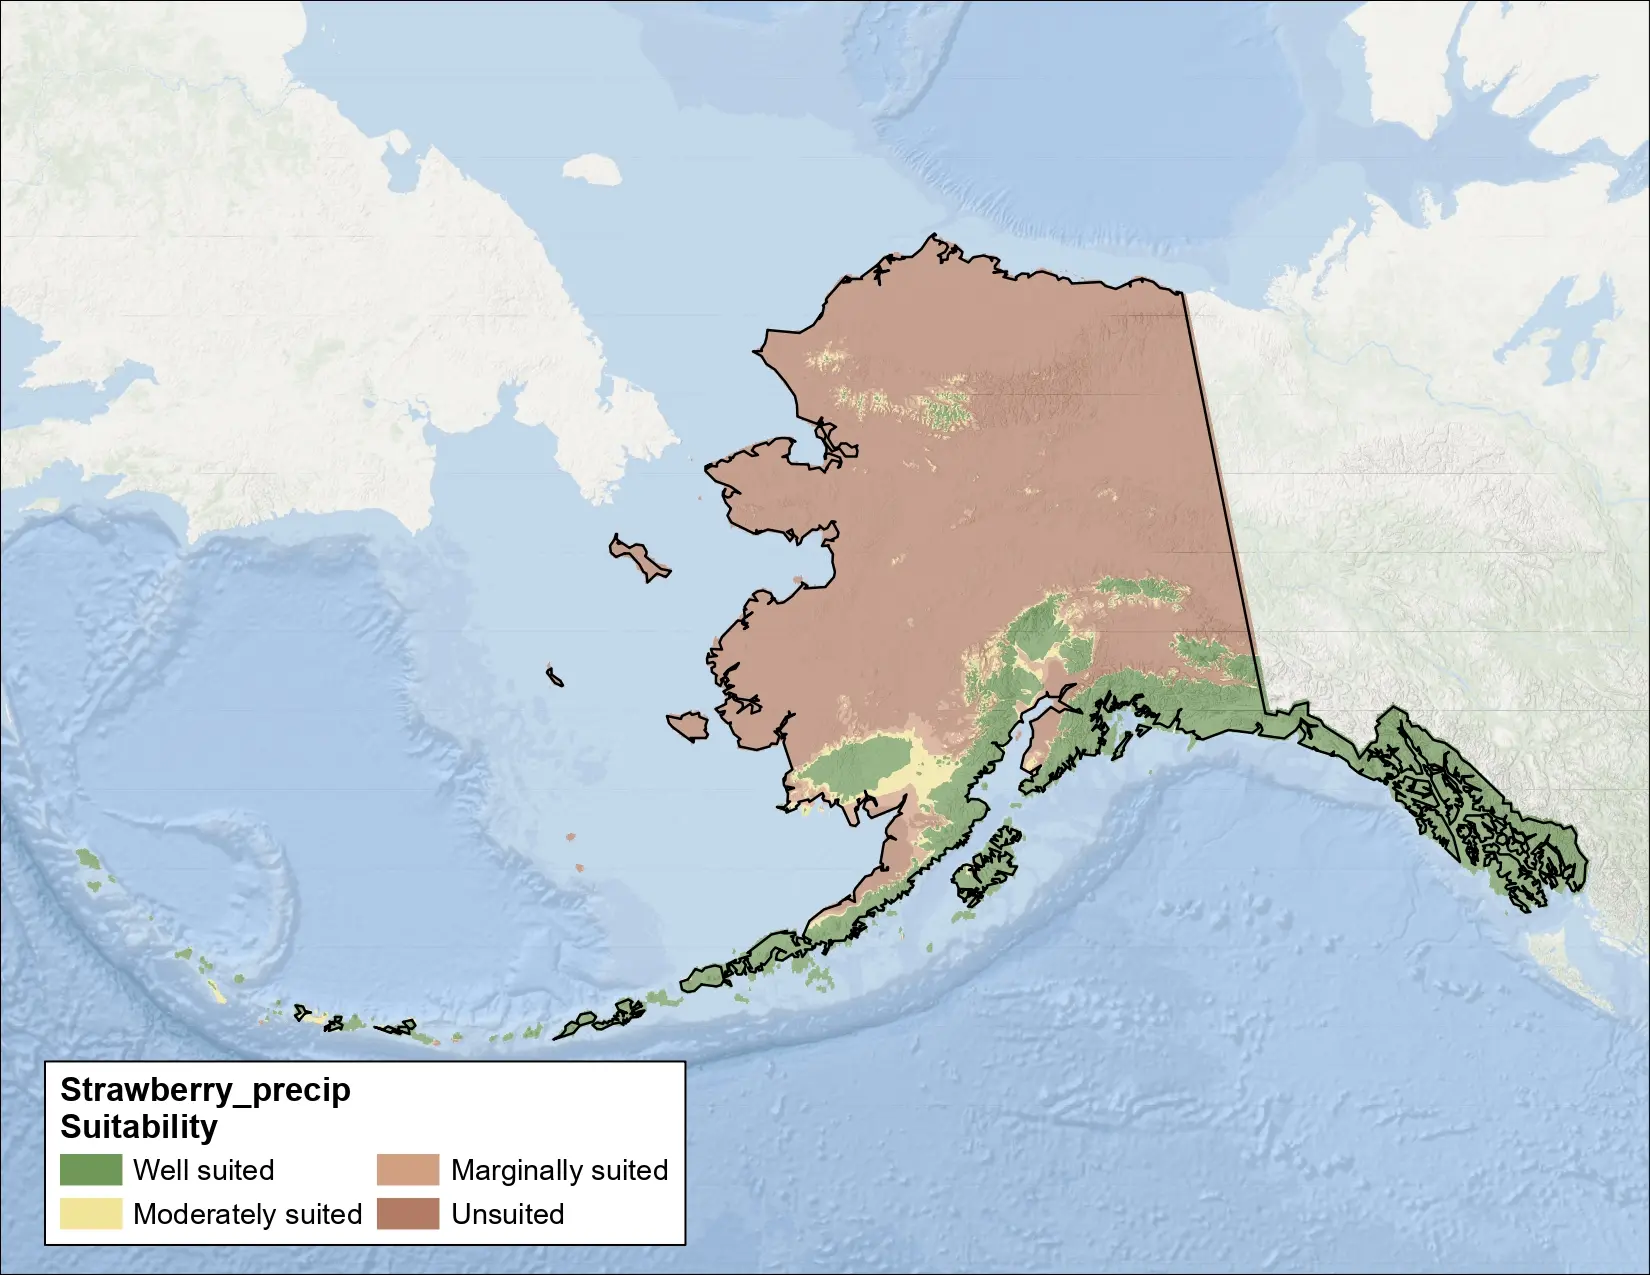
Alaska
| Climate Factors | Soil Factors | Combined Factors |
|---|---|---|
|
Minimum Temperature Image

|
pH Image

|
Climate and Soil Image

|
|
Maximum Temperature Image

|
Drainage Image

|
All Soil Image

|
|
Precipitation Image

|
Salinity Image

|
All Climate Image

|
Hawaii
| Climate Factors | Soil Factors | Combined Factors |
|---|---|---|
|
Minimum Temperature Image

|
pH Image

|
Climate and Soil Image

|
|
Maximum Temperature Image

|
Drainage Image

|
All Soil Image

|
|
Precipitation Image

|
Salinity Image

|
All Climate Image

|
Oregon


Historically, maps have been drawn based on primary use areas, showing broad geographic areas, e.g. Compendium of Common Forages maps within Forages: An Introduction to Grassland Agriculture, 7th ed. (2018), John Wiley & Sons, Inc.
More highly detailed maps, based on quantitative climatic and soil factor tolerances and using GIS spatial grids, provide information on where species are suitable for a variety of intended uses.
The following collection of maps were developed by a group of Oregon State University scientists, using the PRISM-generated collection of climate factor grids and the NRCS soil characteristics database.
Suitability curves were developed for each clover species for three climate variables (average annual precipitation, average July maximum temperature, and average annual extreme low temperature) and three soil variables (drainage class, pH, and salinity). For each variable and each species, the curves were fit using estimated yield data across the full range of values for the given variable.
The coefficients for the model equations were applied to spatial data layers representing each climate and soil variable, resulting in spatial outputs of percent yield for each of the clover species and each climate and soil variable. The percent yield layers were then classified into four suitability classes, as follows:
100%-75% - Suitable
75%-50% - Moderately suitable
50%-25% - Marginally suitable
25-0% - Not suitable
Finally, three "hybrid" suitability layers were produced for each clover species based on combinations of 1) the three climate variables, 2) the three soil variables, and 3) all six climate and soil variables together. These combined suitability layers were created by selecting for each location the lowest suitability value of the included variables, with the idea that the overall suitability for a species will be limited by the most restrictive factor.
QUANTITATIVE TOLERANCES GIS-BASED MAPS


Berseem clover primary use areas as a summer or winter annual.
Source: Clark, Andy (ed.). 2007. Berseem Clover. In: Managing Cover Crops Profitably, 3rd ed. Sustainable Agriculture Network, Beltsville, MD.
The Contiguous USA


The Contiguous USA
|
Climate Factors |
Soil Factors |
All Factors Combined |
|---|---|---|
|
Minimum Temperature
|
pH
|
Climate and Soil
|
|
Maximum Temperature
|
Drainage
|
Soil
|
|
Precipitation
|
Salinity
|
Climate
|


Click on the thumbnail image to view a larger map.
QUANTITATIVE TOLERANCES GIS-BASED MAPS
The Contiguous USA
|
Climate Factors |
Soil Factors |
Combined Factors |
|---|---|---|
|
Minimum Temperature
|
pH
|
Climate and Soil
|
|
Maximum Temperature
|
Drainage
|
All Soil
|
|
Precipitation
|
Salinity
|
All Climate
|


Click on the thumbnail image to view a larger map.
QUANTITATIVE TOLERANCES GIS-BASED MAPS
The Contiguous USA
|
Climate Factors |
Soil Factors |
Combined Factors |
|---|---|---|
|
Minimum Temperature
|
pH
|
Climate and Soil
|
|
Maximum Temperature
|
Drainage
|
All Soil Factors (most limiting)
|
|
Precipitation
|
Salinity
|
Climate Factors
|


Click on the thumbnail image to view a larger map.
QUANTITATIVE TOLERANCES GIS-BASED MAPS
The Contiguous USA
|
Climate Factors |
Soil Factors |
Combined Factors |
|---|---|---|
|
Minimum Temperature
|
pH
|
All Climate and Soil
|
|
Maximum Temperature
|
Drainage
|
All Soil |
|
Precipitation
|
Salinity
|
All Climate
|


Click on the thumbnail image to view a larger map.
QUANTITATIVE TOLERANCES GIS-BASED MAPS
The Contiguous USA
|
Climate Factors |
Soil Factors |
Combined Factors |
|---|---|---|
|
Minimum Temperature Image
|
pH Image
|
All Climate and Soil Image

|
|
Maximum Temperature Image
|
Drainage Image

|
All Soil Image

|
|
Precipitation Image
|
Salinity Image

|
All Climate Image
|
Click on the thumbnail image to view a larger map.
QUANTITATIVE TOLERANCES GIS-BASED MAPS
The Contiguous USA
|
Climate Factors |
Soil Factors |
Combined Factors |
|---|---|---|
|
Minimum Temperature Image
|
pH Image
|
Climate and Soil
|
|
Maximum Temperature Image
|
Drainage Image
|
All Soil
|
|
Precipitation Image
|
Salinity Image

|
All Climate Image

|
Click on the thumbnail image to view a larger map.
Historically, maps have been drawn based on primary use areas, showing broad geographic areas, e.g. Compendium of Common Forages maps within Forages: An Introduction to Grassland Agriculture, 7th ed. (2018), John Wiley & Sons, Inc.
(Crimson clover adaptation and use map.)

(Crimson clover SARE cover crop map. Source: Managing Cover Crops Profitably, 3rd Ed., Sustainable Agriculture Research & Education.)
More highly detailed maps, based on quantitative climatic and soil factor tolerances and using GIS spatial grids, provide information on where species are suitable for a variety of intended uses.
The following collection of maps were developed by a group of Oregon State University scientists, using the PRISM-generated collection of climate factor grids and the NRCS soil characteristics database.
Quantitative Tolerances GIS-based Maps
The Contiguous USA
| Climate Factors | Soil Factors | Combined Factors |
|---|---|---|
|
Minimum Temperature Image

|
pH Image

|
Climate and Soil Image

|
|
Maximum Temperature Image

|
Drainage Image

|
All Soil Image

|
|
Precipitation Image

|
Salinity Image

|
All Climate Image

|
State Maps
Alaska
|
Climate Factor |
Soil Factors | Combined Factors |
|---|---|---|
|
Minimum Temperature Image

|
pH Image

|
Climate and Soil Image

|
|
Maximum Temperature Image

|
Drainage Image

|
All Soil Image

|
|
Precipitation Image

|
Salinity Image

|
All Climate Image

|
Hawaii
|
Climate Factor |
Soil Factors | Combined Factors |
|---|---|---|
|
Minimum Temperature Image

|
pH Image

|
Climate and Soil Image

|
|
Maximum Temperature Image

|
Drainage Image

|
All Soil Image

|
|
Precipitation Image

|
Salinity Image

|
All Climate Image

|
Oregon


QUANTITATIVE TOLERANCES GIS-BASED MAPS
The Contiguous USA
|
Climate Factors |
Soil Factors |
Combined Factors |
|---|---|---|
|
Minimum Temperature Image
|
pH Image
|
All Climate and Soil |
|
Maximum Temperature Image
|
Drainage Image
|
All Soil
|
|
Precipitation Image
|
Salinity Image

|
All Climate |
Click on the thumbnail image to view a larger map.
QUANTITATIVE TOLERANCES GIS-BASED MAPS
The Contiguous USA
|
Climate Factors |
Soil Factors |
Combined Factors |
|---|---|---|
|
Minimum Temperature Image
|
pH Image
|
All Climate and Soil
|
|
Maximum Temperature Image
|
Drainage Image
|
All Soil
|
|
Precipitation Image
|
Salinity Image

|
All Climate Image

|
Click on the thumbnail image to view a larger map.
QUANTITATIVE TOLERANCES GIS-BASED MAPS
The Contiguous USA
|
Climate Factors |
Soil Factors |
Combined Factors |
|
Minimum Temperature Image
|
pH Image

|
All Climate and Soil Image

|
|
Maximum Temperature Image
|
Drainage Image

|
All Soil Image

|
|
Precipitation Image

|
Salinity Image

|
All Climate Image

|
Click on the thumbnail image to view a larger map.
QUANTITATIVE TOLERANCES GIS-BASED MAPS
The Contiguous USA
|
Climate Factors |
Soil Factors |
Combined Factors |
|---|---|---|
|
Minimum Temperature Image

|
pH Image
|
All Climate and Soil
|
|
Maximum Temperature Image
|
Drainage Image
|
All Soil Factors
|
|
Precipitation Image
|
Salinity Image

|
All Climate
|
Click on the thumbnail image to view a larger map.
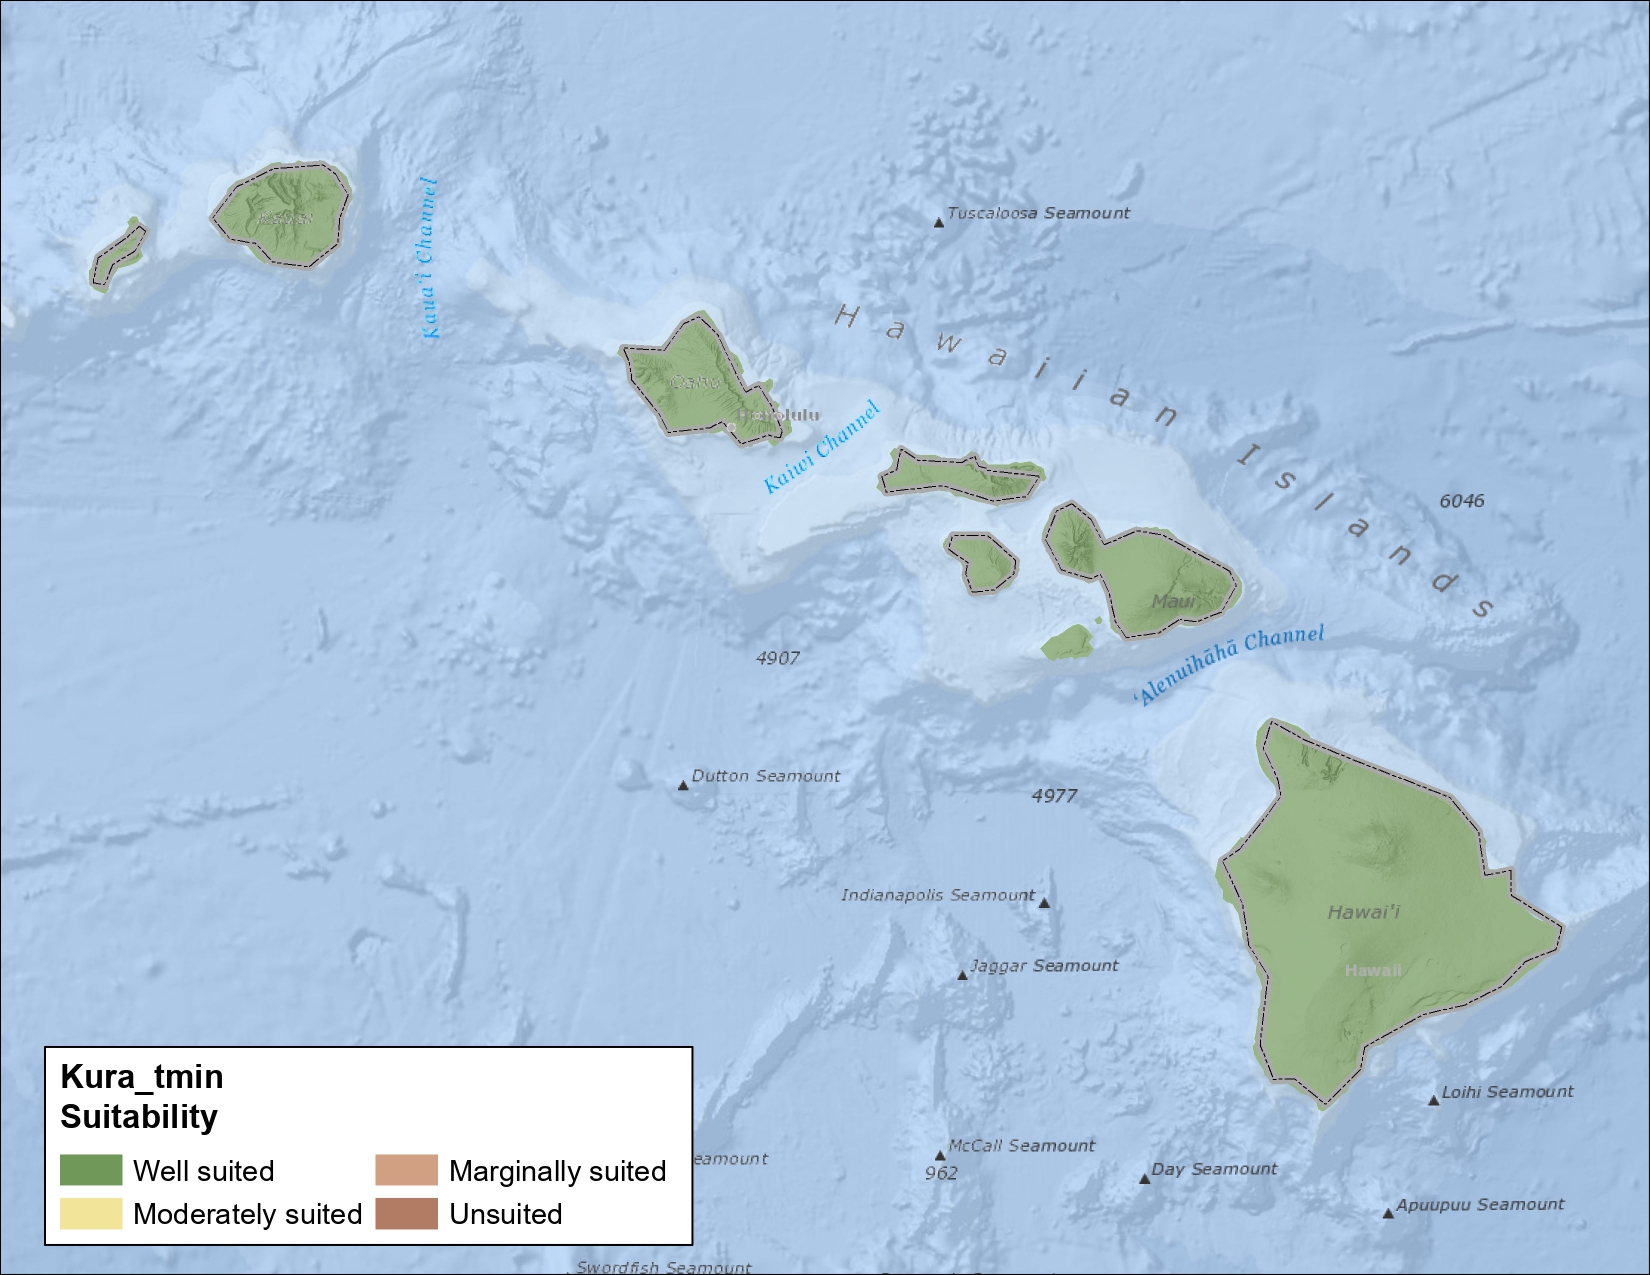
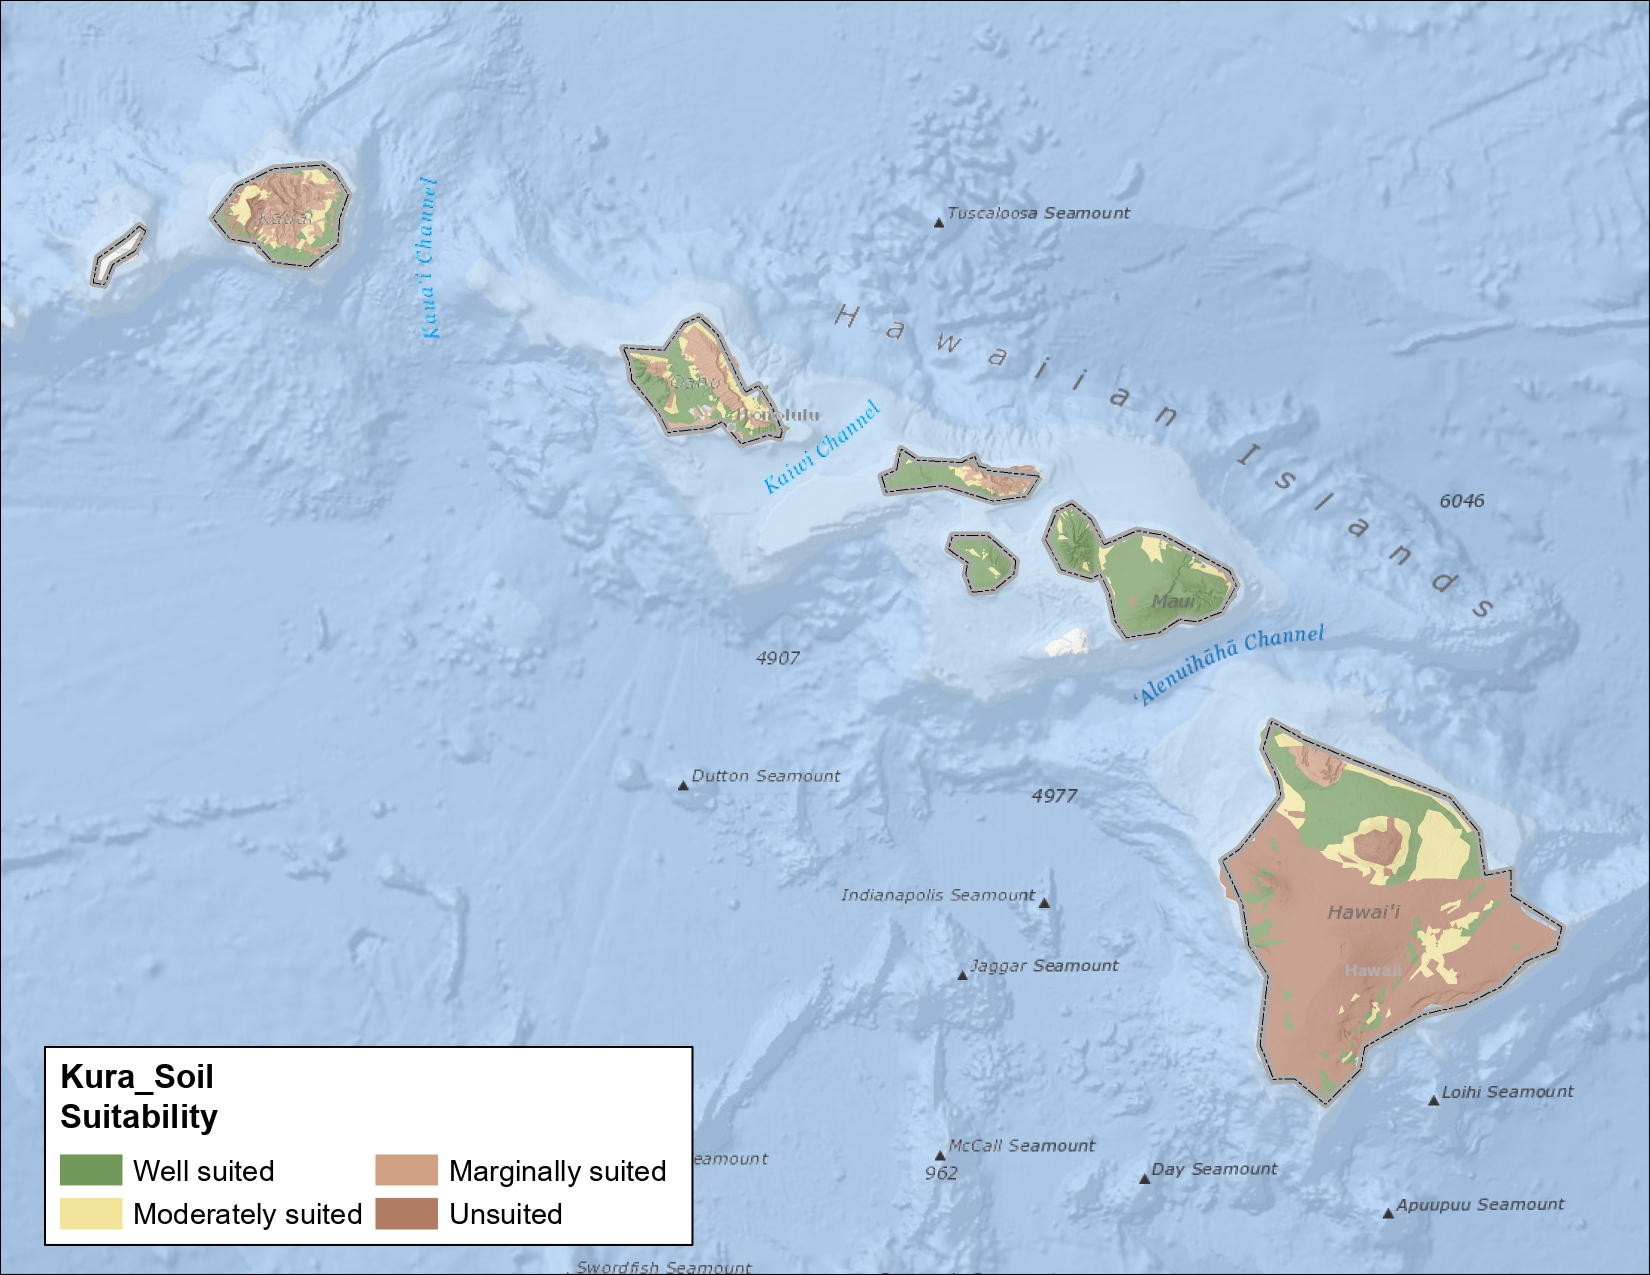
Historically, maps have been drawn based on primary use areas, showing broad geographic areas, e.g. Compendium of Common Forages maps within Forages: An Introduction to Grassland Agriculture, 7th ed. (2018), John Wiley & Sons, Inc.
(Kura clover adaptation and use map.)
More highly detailed maps, based on quantitative climatic and soil factor tolerances and using GIS spatial grids, provide information on where species are suitable for a variety of intended uses.
The following collection of maps were developed by a group of Oregon State University scientists, using the PRISM-generated collection of climate factor grids and the NRCS soil characteristics database.
Quantitative Tolerances GIS-based Maps
The Contiguous USA
| Climate Factors | Soil Factors | Combined Factors |
|---|---|---|
|
Minimum Temperature Image
|
pH Image

|
Climate and Soil Image

|
|
Maximum Temperature Image

|
Drainage Image

|
All Soil Image
|
|
Precipitation Image

|
Salinity Image

|
All Climate Image

|
State Maps
Alaska
| Climate Factors | Soil Factors | Combined Factors |
|---|---|---|
|
Minimum Temperature Image

|
pH Image

|
Climate and Soil Image

|
|
Maximum Temperature Image

|
Drainage Image

|
All Soil Image

|
|
Precipitation Image

|
Salinity Image

|
All Climate Image

|
Hawaii
| Climate Factors | Soil Factors | Combined Factors |
|---|---|---|
|
Minimum Temperature Image
|
pH Image

|
Climate and Soil Image

|
|
Maximum Temperature Image

|
Drainage Image

|
All Soil Image
|
|
Precipitation Image
|
Salinity Image

|
All Climate Image

|
Oregon


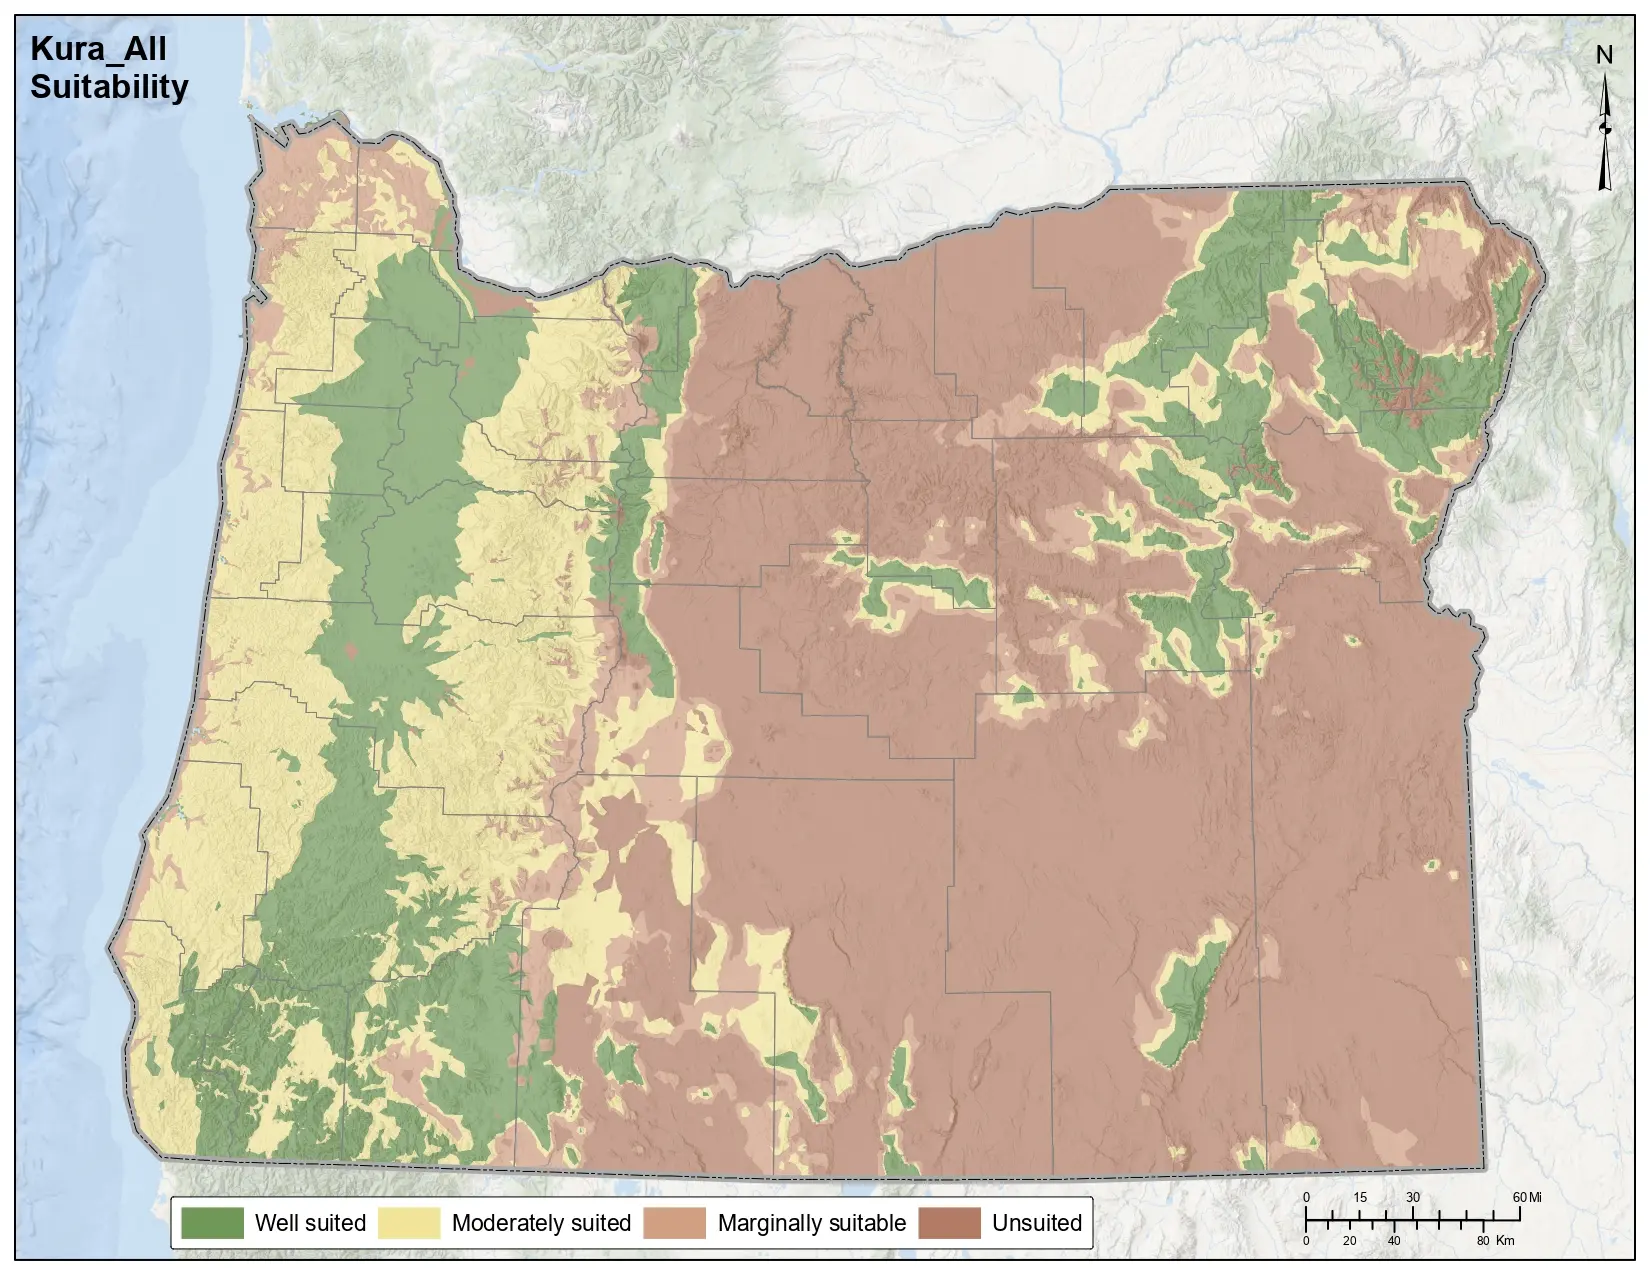
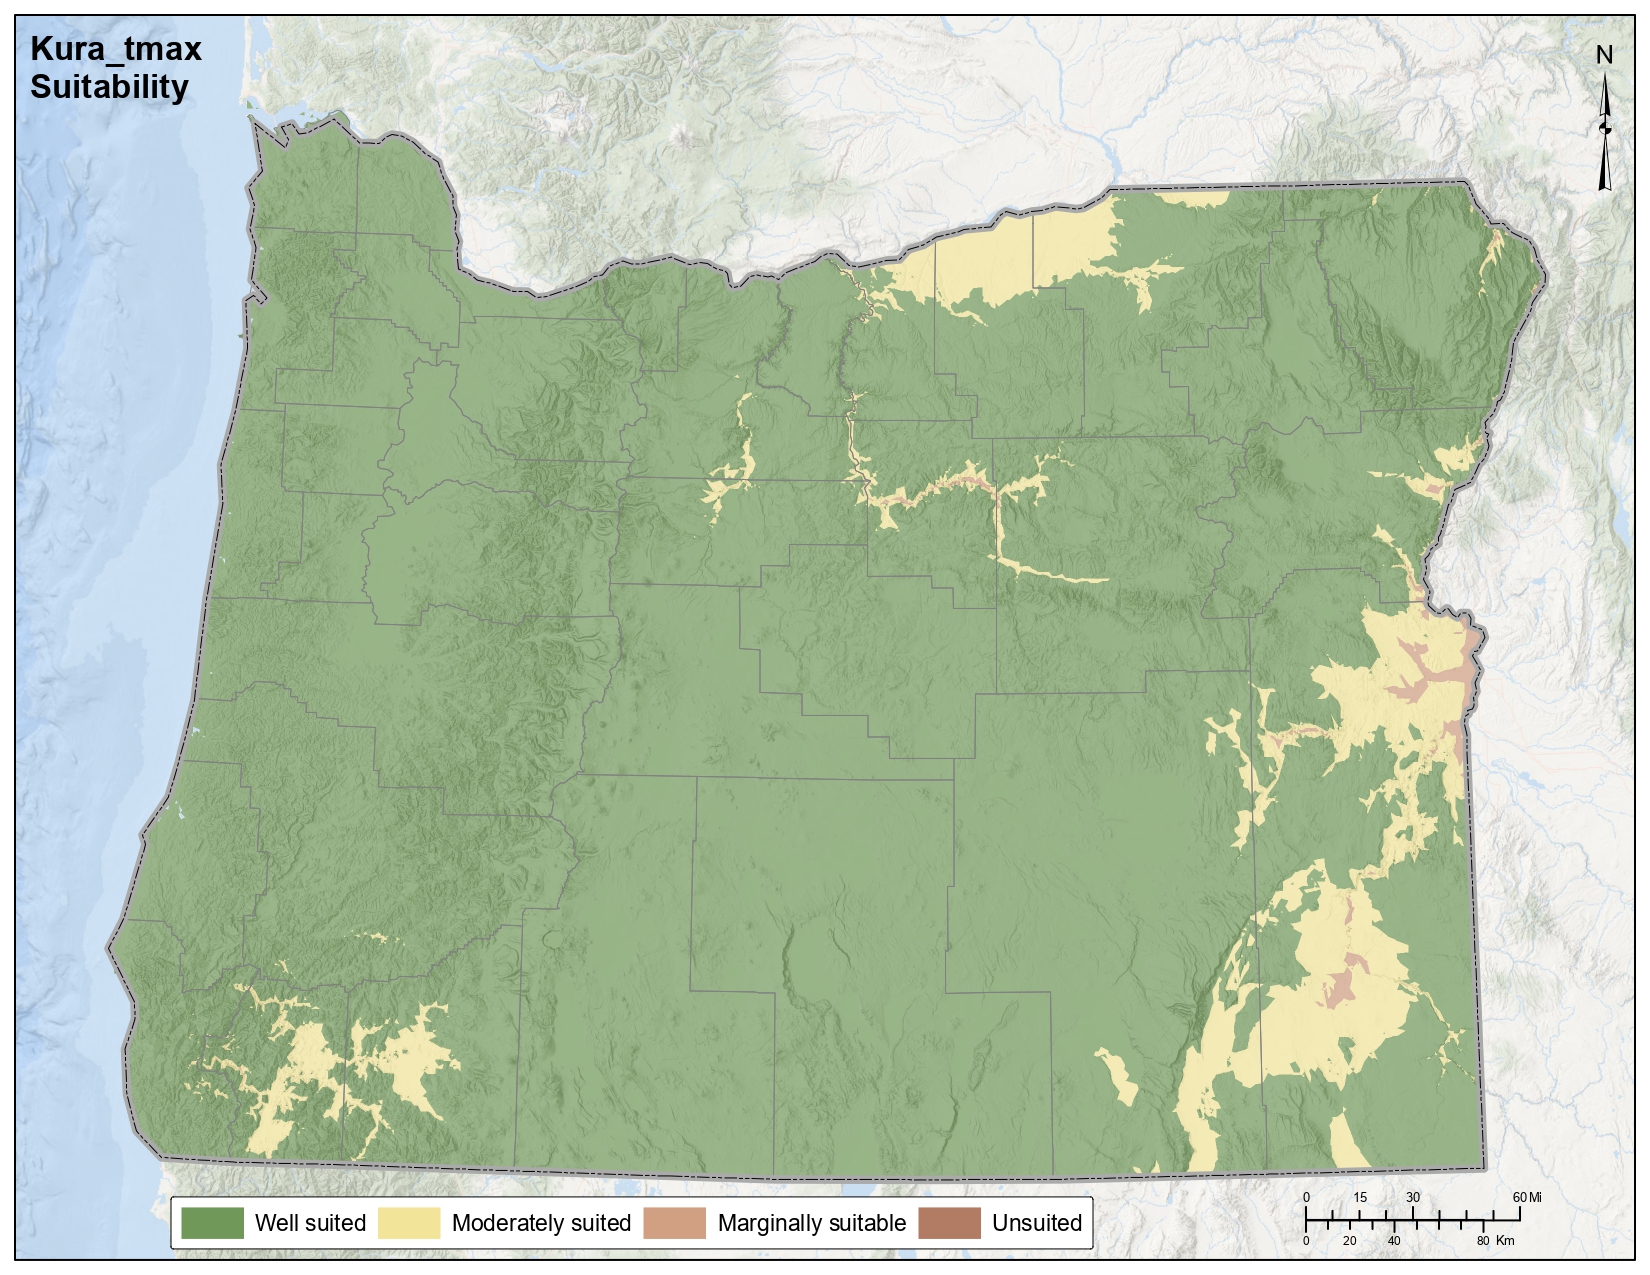


QUANTITATIVE TOLERANCES GIS-BASED MAPS
The Contiguous USA
|
Climate Factors |
Soil Factors |
Combined Factors |
|---|---|---|
|
Minimum Temperature Image
|
pH Image

|
All Climate and Soil Image

|
|
Maximum Temperature Image

|
Drainage Image
|
All Soil
|
|
Precipitation Image
|
Salinity Image
|
All Climate |
Click on the thumbnail image to view a larger map.
The following collection of maps were developed by a group of Oregon State University scientists, using the PRISM-generated collection of climate factor grids and the NRCS soil characteristics database. The procedure used to produce these suitability maps is described below.
Suitability curves were developed for each clover species for three climate variables (average annual precipitation, average July maximum temperature, and average annual extreme low temperature) and three soil variables (drainage class, pH, and salinity). For each variable and each species, the curves were fit using estimated yield data across the full range of values for the given variable.
The coefficients for the model equations were applied to spatial data layers representing each climate and soil variable, resulting in spatial outputs of percent yield for each of the clover species and each climate and soil variable. The percent yield layers were then classified into four suitability classes, as follows:
100%-75% - Suitable
75%-50% - Moderately suitable
50%-25% - Marginally suitable
25-0% - Not suitable
QUANTITATIVE TOLERANCES GIS-BASED MAPS
The Contiguous USA
|
Climate Factors |
Soil Factors |
Combined Factors |
|---|---|---|
|
Minimum Temperature Image
|
pH Image

|
All Climate and Soil Image

|
|
Maximum Temperature Image
|
Drainage Image
|
All Soil Image

|
|
Precipitation Image

|
Salinity Image

|
All Climate Image
|
Finally, three "hybrid" suitability layers were produced for each clover species based on combinations of 1) the three climate variables, 2) the three soil variables, and 3) all six climate and soil variables together. These combined suitability layers were created by selecting for each location the lowest suitability value of the included variables, with the idea that the overall suitability for a species will be limited by the most restrictive factor.
Historically, maps have been drawn based on primary use areas, showing broad geographic areas, e.g. Compendium of Common Forages maps within Forages: An Introduction to Grassland Agriculture, 7th ed. (2018), John Wiley & Sons, Inc.
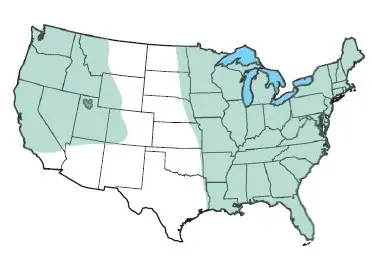
(Red clover adaptation and use map.)
More highly detailed maps, based on quantitative climatic and soil factor tolerances and using GIS spatial grids, provide information on where species are suitable for a variety of intended uses.
The following collection of maps were developed by a group of Oregon State University scientists, using the PRISM-generated collection of climate factor grids and the NRCS soil characteristics database.
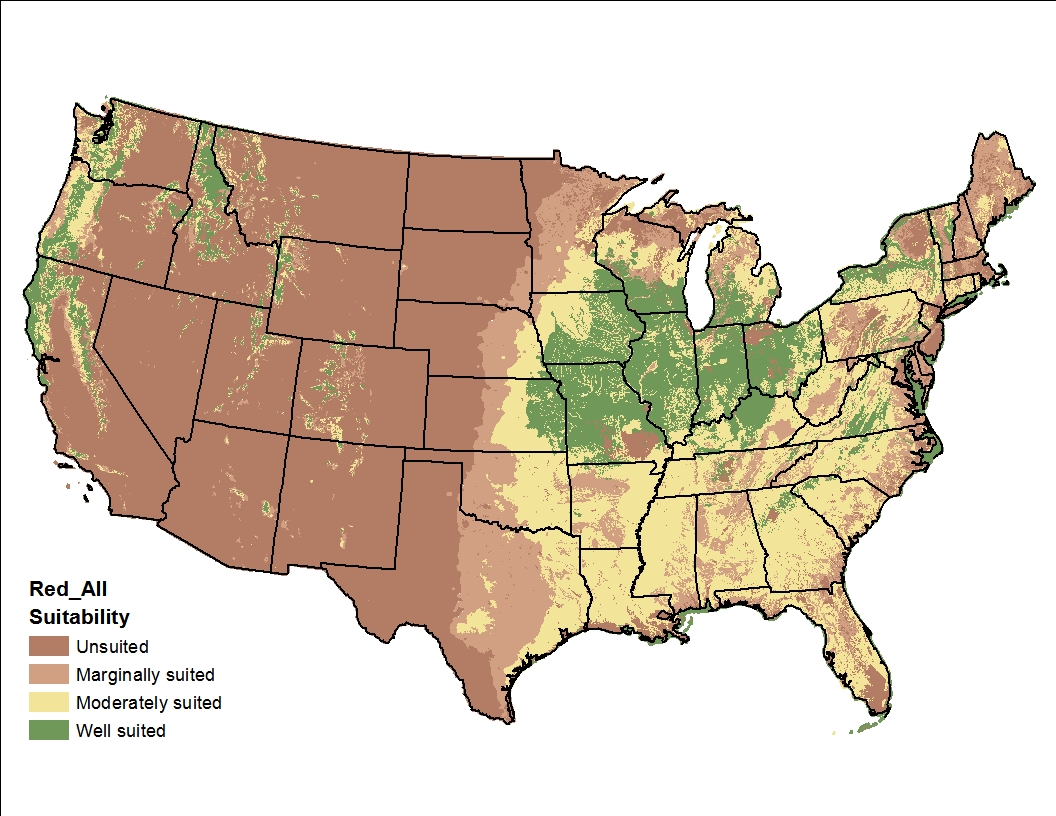
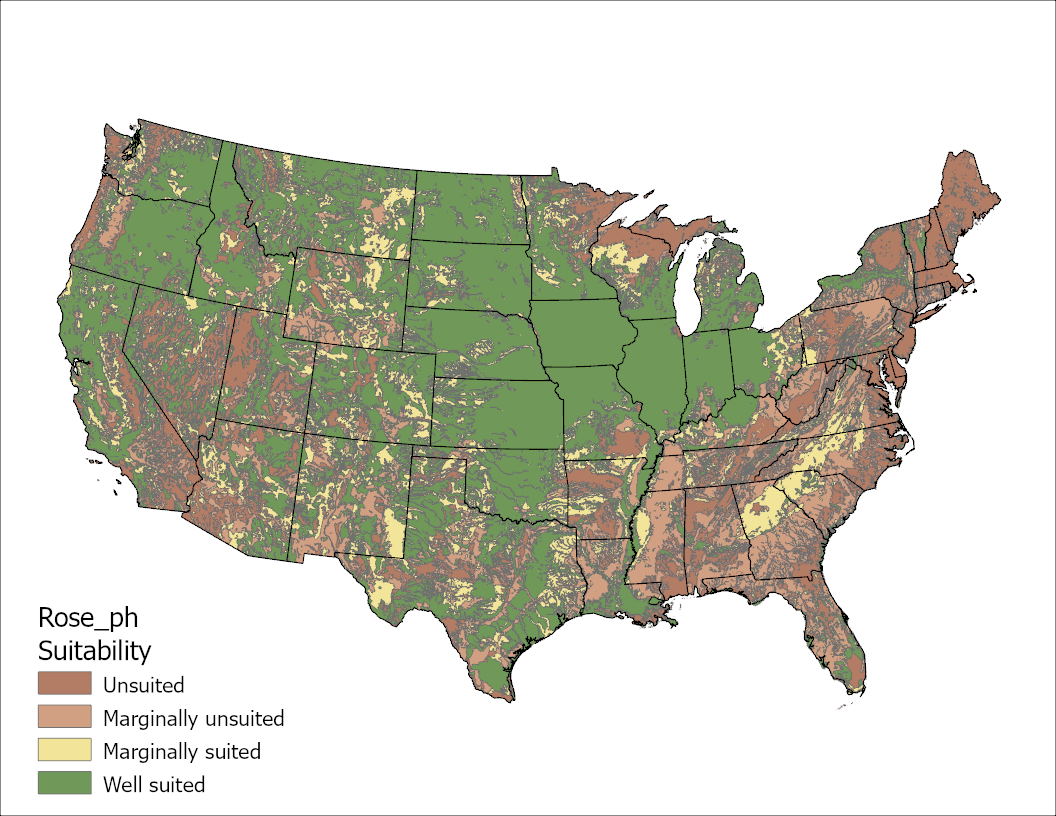
Quantitative Tolerances GIS-based Maps
The contiguous USA
| Climate Factors | Soil Factors | Combined Factors |
|---|---|---|
|
Minimum Temperature Image

|
pH Image

|
Climate and Soil Image
|
|
Maximum Temperature Image

|
Drainage Image

|
All Soil Image

|
|
Precipitation Image

|
Salinity Image

|
All Climate Image

|
State Maps
Alaska
| Climate Factors | Soil Factors | Combined Factors |
|---|---|---|
|
Minimum Temperature Image

|
pH Image

|
Climate and Soil Image

|
|
Maximum Temperature Image

|
Drainage Image

|
All Soil Image

|
|
Precipitation Image
|
Salinity Image

|
All Climate Image
|
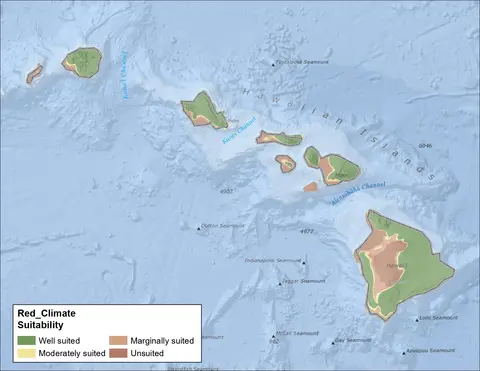
Hawaii
| Climate Factors | Soil Factors | Combined Factors |
|---|---|---|
|
Minimum Temperature Image

|
pH Image

|
Climate and Soil Image

|
|
Maximum Temperature Image

|
Drainage Image

|
All Soil Image

|
|
Precipitation Image

|
Salinity Image

|
All Climate Image
|
Oregon


The following collection of maps were developed by a group of Oregon State University scientists, using the PRISM-generated collection of climate factor grids and the NRCS soil characteristics database. The procedure used to produce these suitability maps is described below.
Suitability curves were developed for each clover species for three climate variables (average annual precipitation, average July maximum temperature, and average annual extreme low temperature) and three soil variables (drainage class, pH, and salinity). For each variable and each species, the curves were fit using estimated yield data across the full range of values for the given variable.
The coefficients for the model equations were applied to spatial data layers representing each climate and soil variable, resulting in spatial outputs of percent yield for each of the clover species and each climate and soil variable. The percent yield layers were then classified into four suitability classes, as follows:
100%-75% - Suitable
75%-50% - Moderately suitable
50%-25% - Marginally suitable
25-0% - Not suitable
Finally, three "hybrid" suitability layers were produced for each clover species based on combinations of 1) the three climate variables, 2) the three soil variables, and 3) all six climate and soil variables together. These combined suitability layers were created by selecting for each location the lowest suitability value of the included variables, with the idea that the overall suitability for a species will be limited by the most restrictive factor.
Quantitative Tolerances Gis-based Maps
The contiguous USA


QUANTITATIVE TOLERANCES GIS-BASED MAPS
The Contiguous USA
|
Climate Factors |
Soil Factors |
Combined Factors |
|---|---|---|
|
Minimum Temperature Image
|
pH Image
|
All Climate and Soil
|
|
Maximum Temperature Image
|
Drainage Image
|
All Soil
|
|
Precipitation Image
|
Salinity Image

|
All Climate Image
|
Click on the thumbnail image to view a larger map.
Historically, maps have been drawn based on primary use areas, showing broad geographic areas, e.g. Compendium of Common Forages maps within Forages: An Introduction to Grassland Agriculture, 7th ed. (2018), John Wiley & Sons, Inc.
More highly detailed maps, based on quantitative climatic and soil factor tolerances and using GIS spatial grids, provide information on where species are suitable for a variety of intended uses.
The following collection of maps were developed by a group of Oregon State University scientists, using the PRISM-generated collection of climate factor grids and the NRCS soil characteristics database.
GIS-based quantitative tolerances maps
The Contiguous USA
| Climate Factors | Soil Factors | Combined Factors |
|---|---|---|
|
Minimum Temperature Image

|
pH Image

|
Climate and Soil Image
|
|
Maximum Temperature Image

|
Drainage Image

|
All Soil Image

|
|
Precipitation Image

|
Salinity Image

|
All Climate Image

|
State Maps
Alaska
|
Climate Factor |
Soil Factors | Combined Factors |
|---|---|---|
|
Minimum Temperature Image

|
pH Image

|
Climate and Soil Image
|
|
Maximum Temperature Image

|
Drainage Image
|
All Soil Image
|
|
Precipitation Image
|
Salinity Image

|
All Climate Image

|
Hawaii
|
Climate Factor |
Soil Factors | Combined Factors |
|---|---|---|
|
Minimum Temperature Image

|
pH Image
|
Climate and Soil Image

|
|
Maximum Temperature Image

|
Drainage Image

|
All Soil Image

|
|
Precipitation Image

|
Salinity Image

|
All Climate Image

|
Oregon


Historically, maps have been drawn based on primary use areas, showing broad geographic areas, e.g. Compendium of Common Forages maps within Forages: An Introduction to Grassland Agriculture, 7th ed. (2018), John Wiley & Sons, Inc.
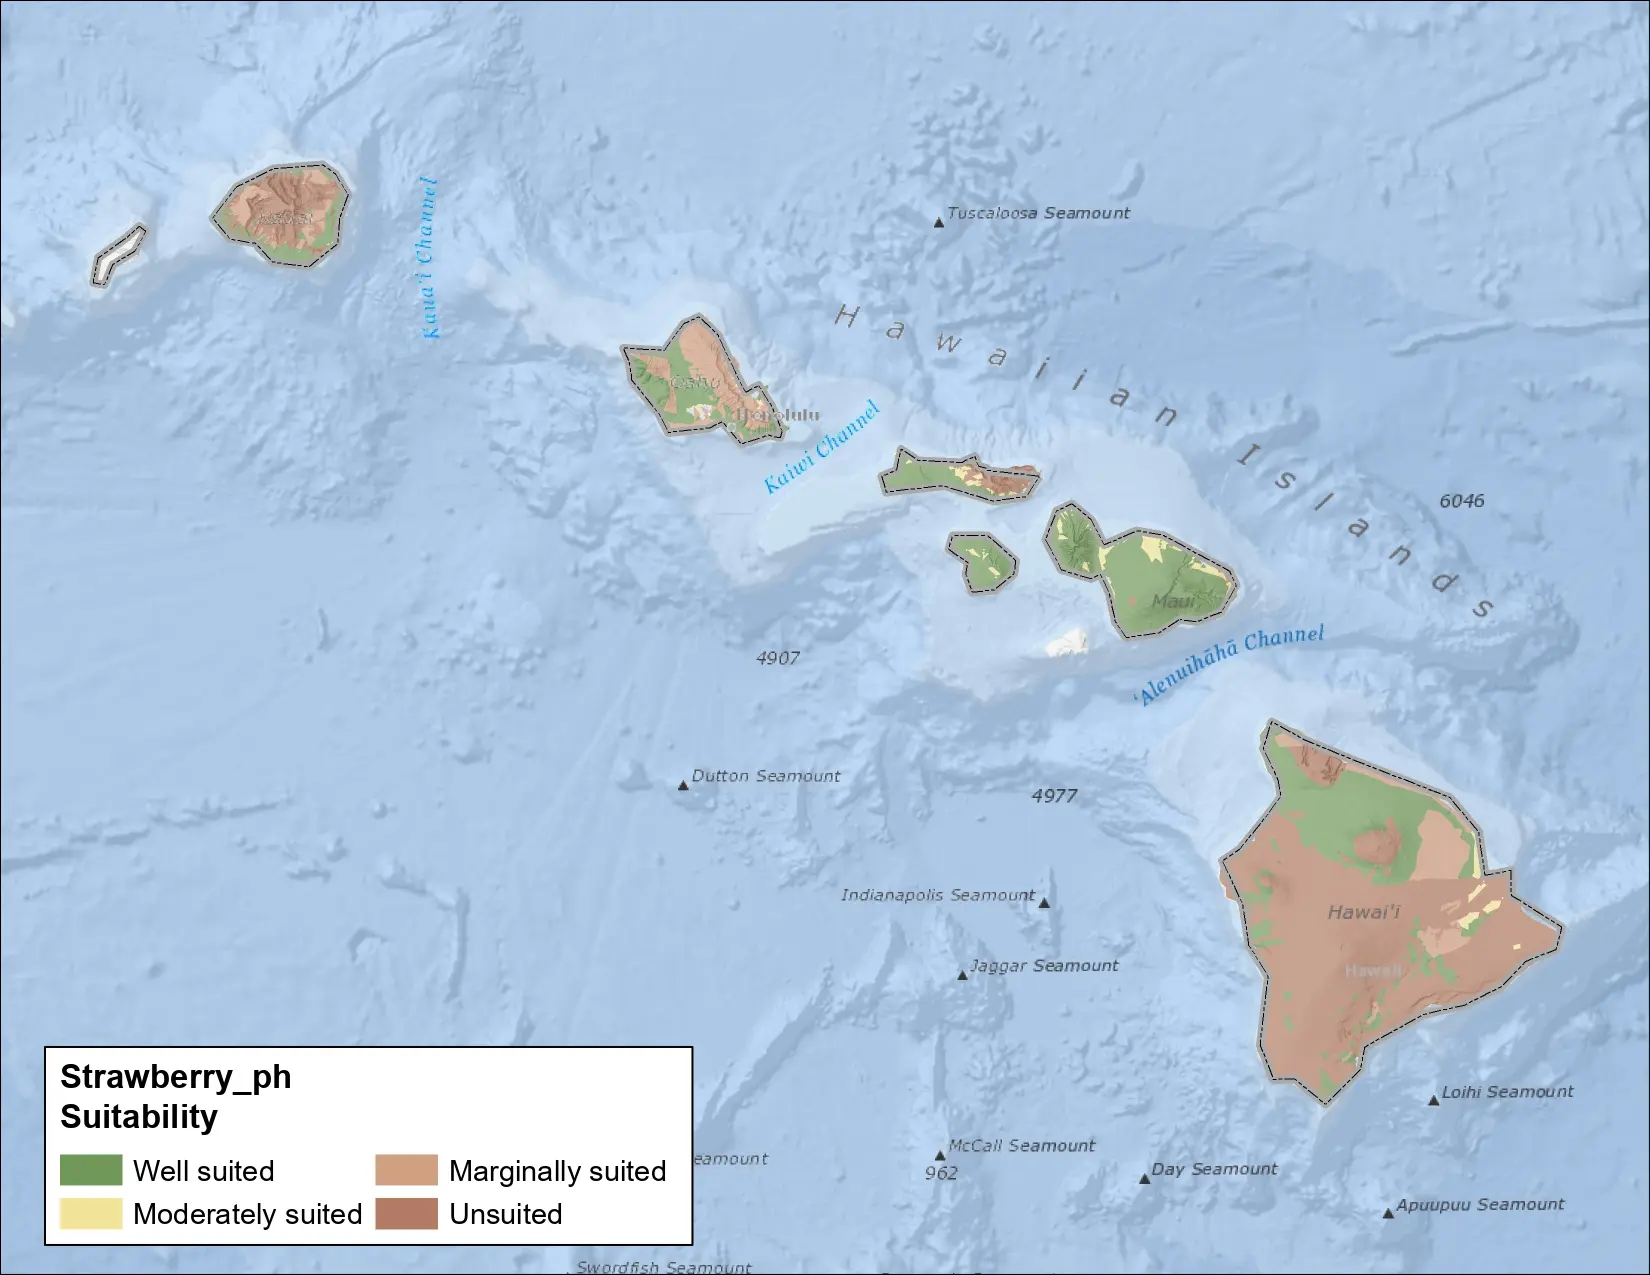
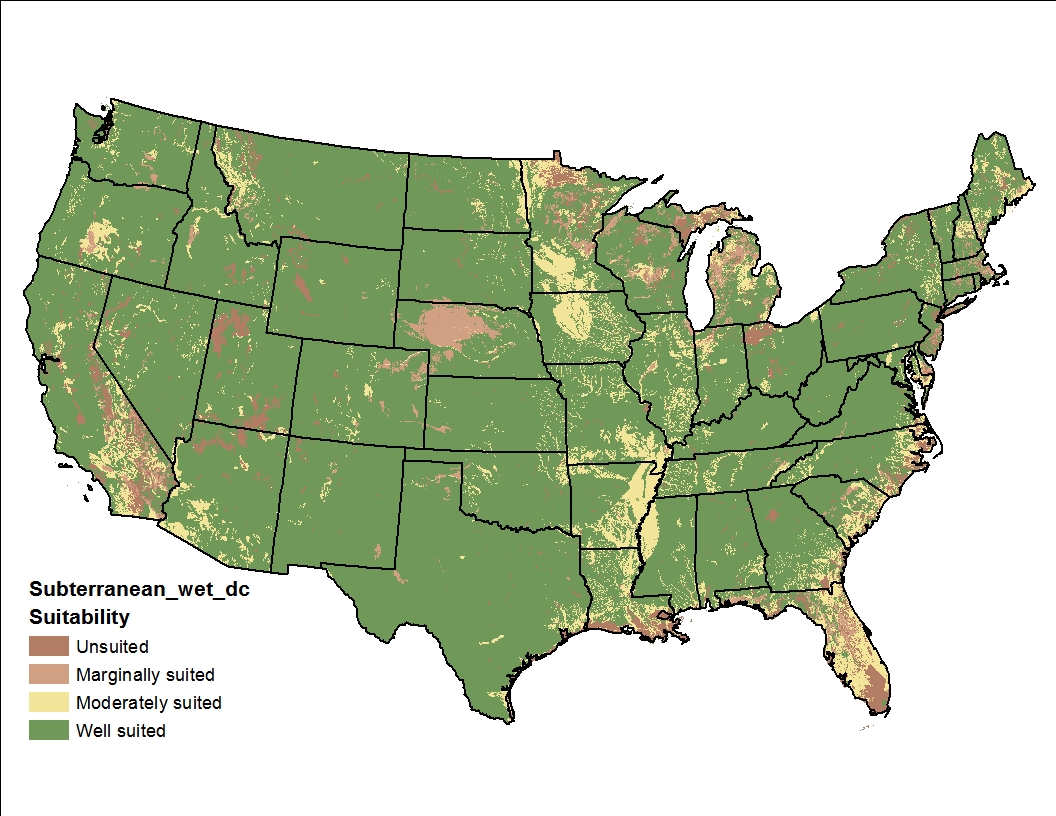
(Subterranean Clover Adaptation & Use Map.)
[[{"fid":"1256","view_mode":"default","fields":{"format":"default","alignment":"center","field_file_image_alt_text[und][0][value]":"Subterranean Clover SARE Cover Crops Map","field_file_image_title_text[und][0][value]":"Subterranean Clover SARE Cover Crops Map","external_url":""},"type":"media","field_deltas":{"2":{"format":"default","alignment":"center","field_file_image_alt_text[und][0][value]":"Subterranean Clover SARE Cover Crops Map","field_file_image_title_text[und][0][value]":"Subterranean Clover SARE Cover Crops Map","external_url":""}},"link_text":null,"attributes":{"alt":"Subterranean Clover SARE Cover Crops Map","title":"Subterranean Clover SARE Cover Crops Map","height":212,"width":278,"class":"media-element file-default media-wysiwyg-align-center","data-delta":"2"}}]]
(SARE Managing Cover Crops Map. Source: Managing Cover Crops Profitably, 3rd Ed., Sustainable Agriculture Research & Education.)
More highly detailed maps, based on quantitative climatic and soil factor tolerances and using GIS spatial grids, provide information on where species are suitable for a variety of intended uses.
The following collection of maps were developed by a group of Oregon State University scientists, using the PRISM-generated collection of climate factor grids and the NRCS soil characteristics database.
Quantitative Tolerances GIS Maps
The contiguous USA
| Climate Factors | Soil Factors | Combined Factors |
|---|---|---|
|
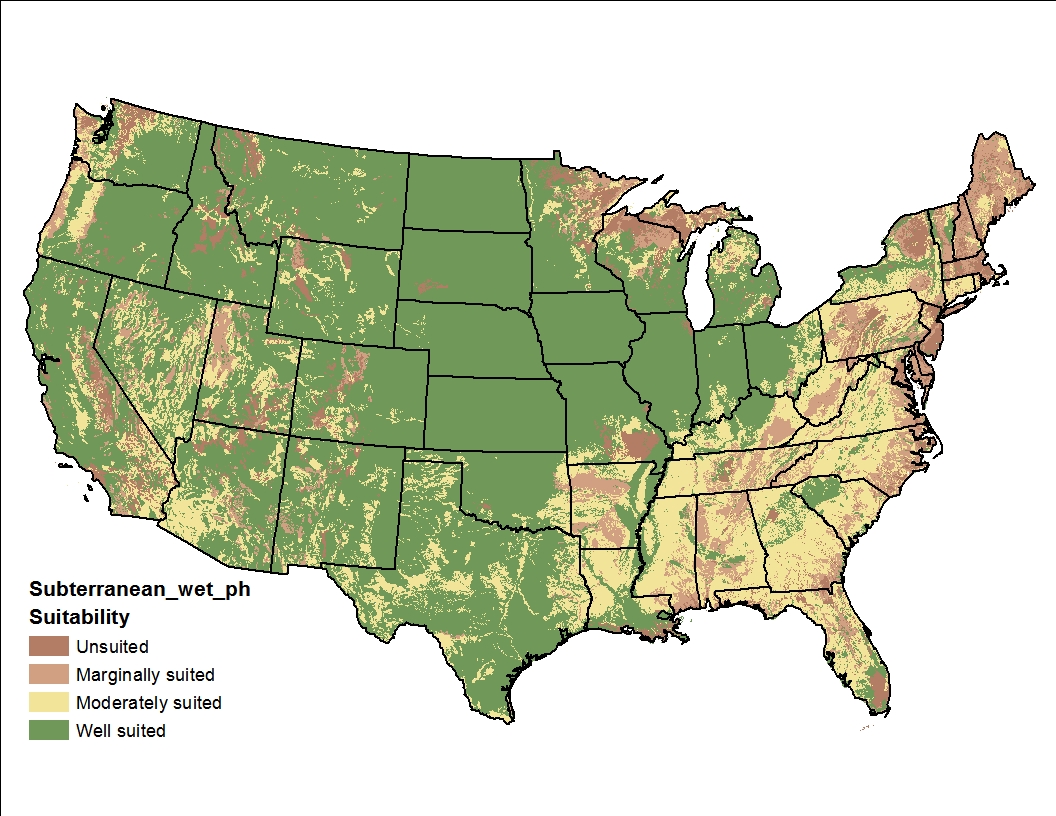
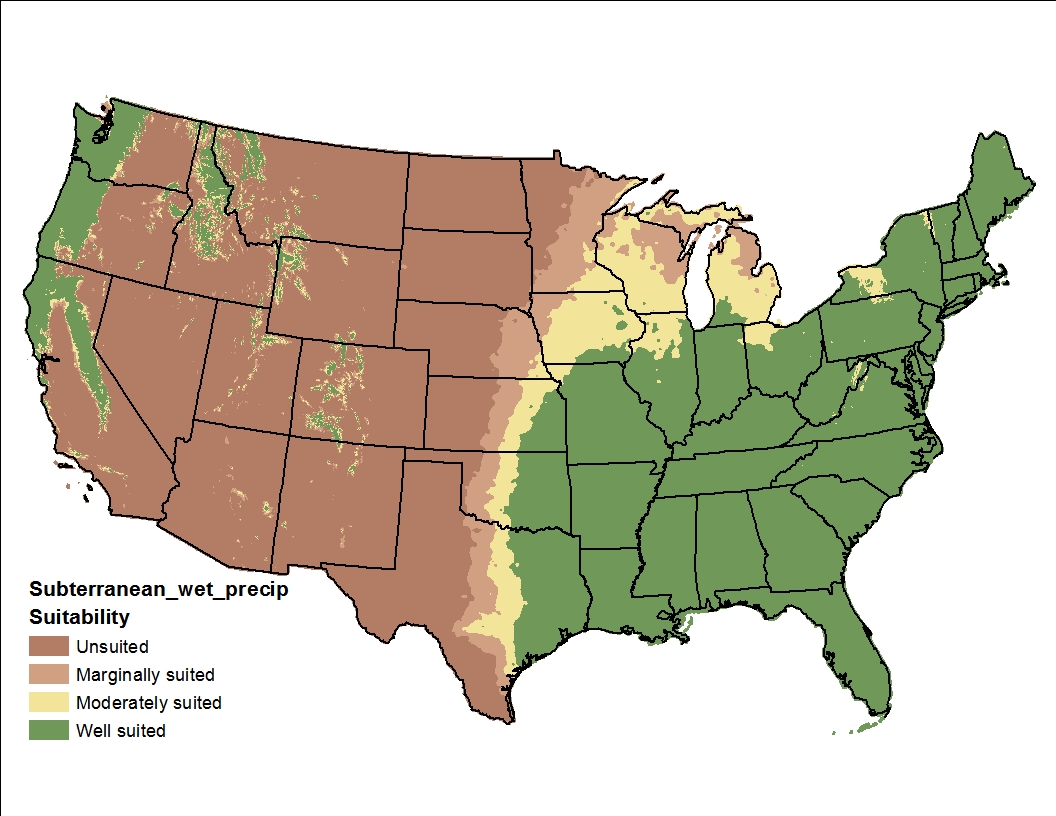
Minimum Temperature Wet Image

|
pH Wet Image
|
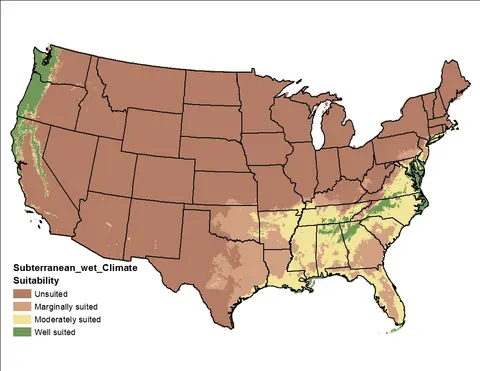
Climate and Soil Wet Image

|
|
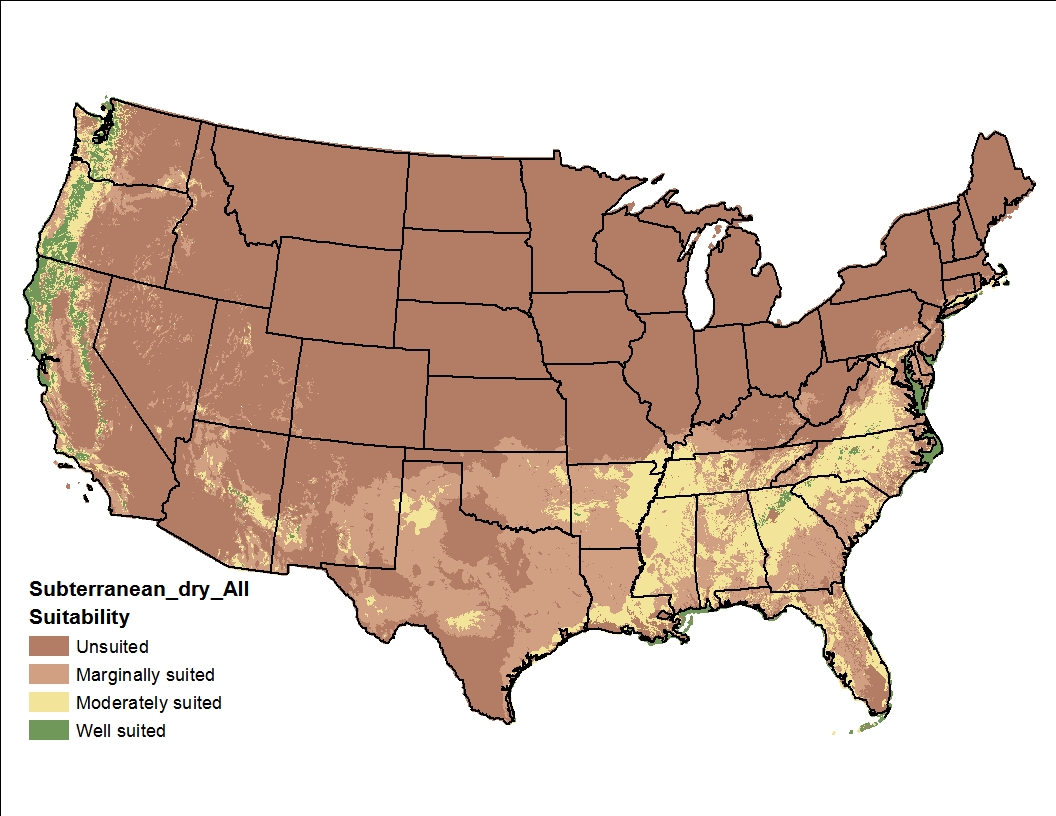
Minimum Temperature Dry Image

|
pH Dry Image

|
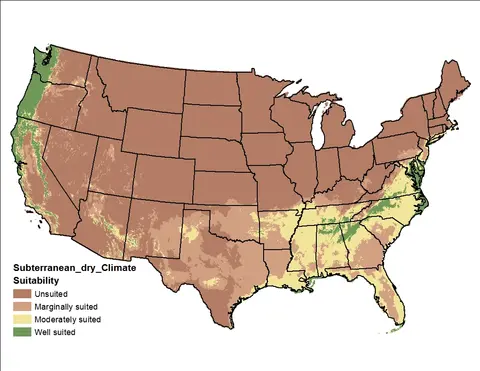
Climate and Soil Dry Image
|
|
Maximum Temperature Wet Image

|
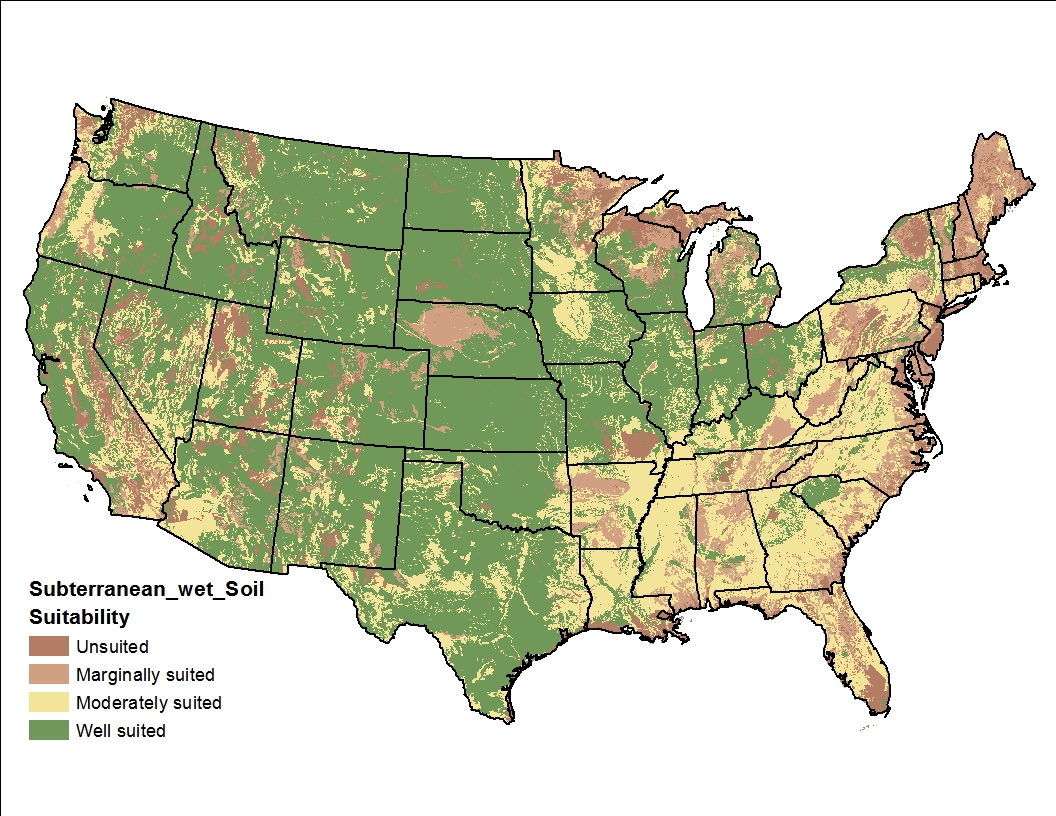
Drainage Wet Image

|
All Soil Image
|
|
Precipitation Wet Image
|
Salinity Wet Image

|
All Climate Wet Image
|
|
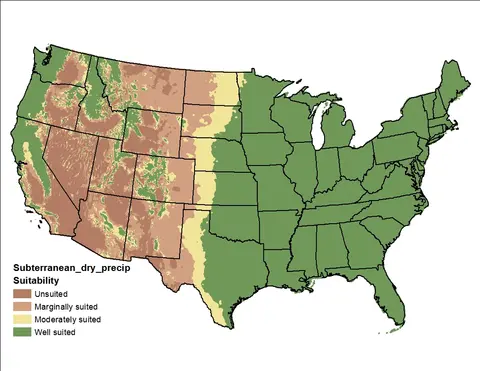
Precipitation Dry Image
|
Salinity Dry Image

|
All Climate Dry Image
|
Map designations of wet and dry refer to different precipitation requirements for current use areas (40-60 inch rainfall zones, designated wet) and potential use areas (16-26 inch rainfall zones, designated dry).
State Maps
Alaska
| Climate Factors | Soil Factors | Combined Factors |
|---|---|---|
|
Minimum Temperature Wet Image

|
pH Wet Image

|
Climate and Soil Wet Image

|
|
Minimum Temperature Dry Image
|
pH Dry Image

|
Climate and Soil Dry Image

|
|
Maximum Temperature Wet Image
|
Drainage Wet Image
|
All Soil Wet Image
|
|
Precipitation Wet Image

|
Salinity Wet Image

|
All Climate Wet Image

|
|
Precipitation Dry Image

|
Salinity Dry Image

|
All Climate Dry Image

|
Hawaii
| Climate Factors | Soil Factors | Combined Factors |
|---|---|---|
|
Minimum Temperature Wet Image

|
pH Wet Image

|
Climate and Soil Wet Image

|
|
Minimum Temperature Dry Image

|
pH Dry Image

|
Climate and Soil Dry Image
|
|
Maximum Temperature Wet Image

|
Drainage Wet Image
|
All Soil Wet Image

|
|
Precipitation Wet Image

|
Salinity Wet Image

|
All Climate Wet Image
|
|
Precipitation Dry Image

|
Salinity Dry Image

|
All Climate Dry Image

|
Oregon
| Climate Factors | Soil Factors | Combined Factors |
|---|---|---|
|
Minimum Temperature Wet Image

|
pH Wet Image

|
Climate and Soil Wet Image

|
|
Minimum Temperature Dry Image

|
pH Dry Image

|
Climate and Soil Dry Image

|
|
Maximum Temperature Wet Image

|
Drainage Wet Image

|
All Soil Wet Image

|
|
Precipitation Wet Image

|
Salinity Wet Image

|
All Climate Wet Image

|
|
Precipitation Dry Image

|
Salinity Dry Image

|
All Climate Dry Image

|
Historically, maps have been drawn based on primary use areas, showing broad geographic areas, e.g. Compendium of Common Forages maps within Forages: An Introduction to Grassland Agriculture, 7th ed. (2018), John Wiley & Sons, Inc.
[[{"fid":"1246","view_mode":"default","fields":{"format":"default","alignment":"center","field_file_image_alt_text[und][0][value]":false,"field_file_image_title_text[und][0][value]":"White clover Adaptation and Use map - FORAGES","external_url":""},"type":"media","field_deltas":{"2":{"format":"default","alignment":"center","field_file_image_alt_text[und][0][value]":false,"field_file_image_title_text[und][0][value]":"White clover Adaptation and Use map - FORAGES","external_url":""}},"link_text":null,"attributes":{"title":"White clover Adaptation and Use map - FORAGES","class":"media-element file-default media-wysiwyg-align-center","data-delta":"2"}}]]
(White clover adaptation an use map.)
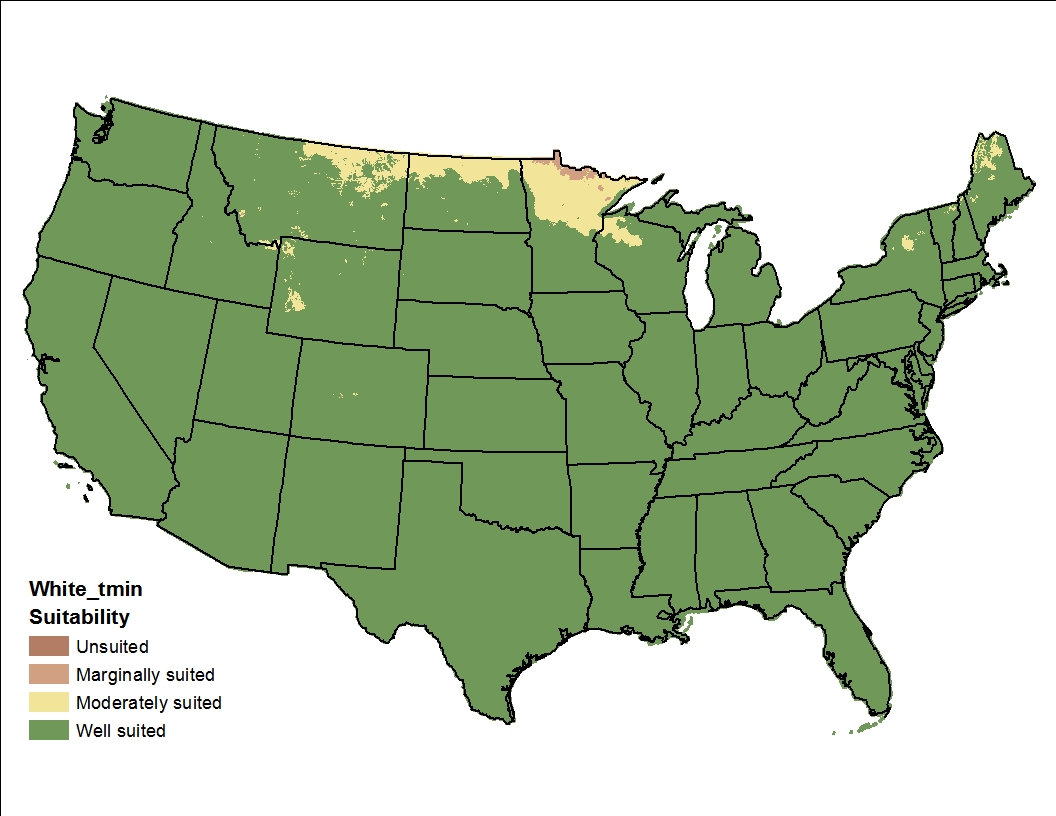
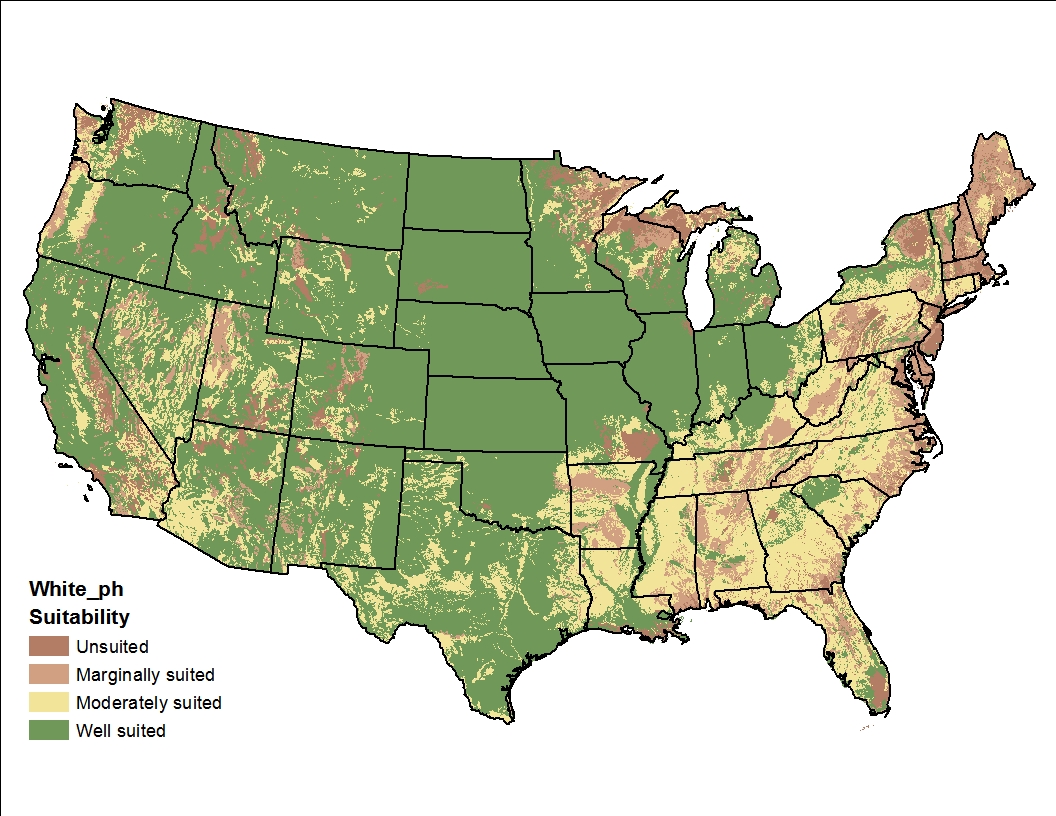
More highly detailed maps, based on quantitative climatic and soil factor tolerances and using GIS spatial grids, provide information on where species are suitable for a variety of intended uses.
The following collection of maps were developed by a group of Oregon State University scientists, using the PRISM-generated collection of climate factor grids and the NRCS soil characteristics database.
GIS-based Quantitative Tolerances Maps
The contiguous U.S.
| Climate Factors | Soil Factors | Combined Factors |
|---|---|---|
|
Minimum Temperature Image
|
pH Image
|
Climate and Soil Image

|
|
Maximum Temperature Image

|
Drainage Image

|
All Soil Image

|
|
Precipitation Image

|
Salinity Image

|
All Climate Image

|
State Maps
Alaska
| Climate Factors | Soil Factors | Combined Factors |
|---|---|---|
|
Minimum Temperature Image

|
pH Image

|
Climate and Soil Image

|
|
Maximum Temperature Image

|
Drainage Image

|
All Soil Image

|
|
Precipitation Image

|
Salinity Image

|
All Climate Image

|
Hawaii
| Climate Factors | Soil Factors | Combined Factors |
|---|---|---|
|
Minimum Temperature Image

|
pH Image

|
Climate and Soil Image

|
|
Maximum Temperature Image

|
Drainage Image

|
All Soil Image

|
|
Precipitation Image

|
Salinity Image

|
All Climate Image

|


