Overview
The climate section provides information on the important aspects of weather and climate that affect forage species selection and management.
Climate is the long-term history of temperature, precipitation, and radiation for a given region. It is the principal factor affecting suitability of forage species or cultivars for a given location. By contrast, weather is day-to-day and short-term ranges of temperature, precipitation, relative humidity, wind, and solar radiation at a given site. Forage producers must be aware of the climate or average year, when selecting adapted species and cultivars. They must be aware of weather events that alter year-to-year productivity and influence day-to-day management decisions.
Climate Classification Systems
The Köppen system is in almost universal use today. It was developed in 1928 by German climatologist and amateur botanist Wladimir Köppen. Köppen updated and modified his system of climate classification until his until his death in 1940. Since it has been modified by a number of geographers, most notably the late Glen Trewartha of the University of Wisconsin. This version is probably in widest use today.
The Köppen System
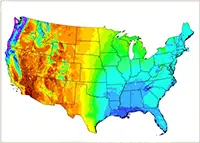
The Köppen system uses letters to denote the six major climate regions and their 24 sub-classifications. These regions are based on average monthly temperature and precipitation values. The Köppen system does not fully account for such factors as cloudiness, solar radiation, wind, or even extremes in temperature, but it remains a useful guide to average climate trends. The individual zones are shown (Figure 1) with clearly delineated boundaries, but it is important to note that the areas between zones are a gradual transition between climates.
Figure 1. Köppen-Geiger 1976-200 climate classification map.
The modified Köppen classification uses six letters to indicate the world’s six major climate regions, based on average annual precipitation, average monthly precipitation, and average monthly temperature:
- A for tropical humid
- B for dry
- C for mild mid-latitude
- D for severe mid-latitude
- E for polar
- H for highland
Spatial Modeling of Climate
Each category is further sub-divided based on temperature and precipitation (Table 1).
For example, the U.S. states located along the Gulf of Mexico are designated as "Cfa." The "C" represents the "mild mid-latitude" category, the second letter "f" stands for the German word feucht or "moist," and the third letter "a" indicates that the average temperature of the warmest month is above 72°F (22°C). Thus, "Cfa" gives us a good indication of the climate of this region, a mild mid-latitude climate with no dry season and a hot summer.
Köppen also used vegetation to aid in climate classification, including tropical rainforest, tropical wet and dry season vegetation, low-latitude steppe, low-latitude desert, Sclerophyll forest, mid-latitude deciduous forest, boreal forest, and tundra vegetation. Sclerophyll forest indicates a type of vegetation adapted to long periods of warm, dry weather.
Sources:
- Arnfield, John A. 2017. Köppen climate classification. https://www.britannica.com/science/Koppen-climate-classification
- Chen, D. and H. W. Chen, 2013: Using the Köppen classification to quantify climate variation and change: An example for 1901–2010. Environmental Development, 6, 69-79, 10.1016/j.envdev.2013.03.007. http://hanschen.org/koppen/
- Köppen climate classification: https://en.wikipedia.org/wiki/K%C3%B6ppen_climate_classification.
- Rosenberg, Matt. "Koppen Climate Classification System." ThoughtCo, Mar. 30, 2017, http://thoughtco.com/koppen-climate-classification-system-1435336.
More recently, climate station data has been applied to spatial models of climate elements including precipitation, minimum and maximum temperature, relative humidity, and solar radiation. These models have typically used distance weighting approaches that work well for flat conditions. However, these purely statistical models poorly describe mountainous areas with detailed topography and coastal regions. PRISM methods address these issues and provide detailed, accurate modeling of real-world conditions (Daly et al., 2002). The climate spatial layers used in this project were developed with PRISM.
Table 1. Köppen climate classification chart.
|
A |
Tropical humid |
Af |
Tropical wet |
No dry season |
|---|---|---|---|---|
|
|
|
Am |
Tropical monsoonal |
Short dry season; heavy monsoonal rains in other months |
|
|
|
Aw |
Tropical savanna |
Winter dry season |
|
B |
Dry |
BWh |
Subtropical desert |
Low-latitude desert |
|
|
|
BSh |
Subtropical steppe |
Low-latitude dry |
|
|
|
BWk |
Mid-latitude desert |
Mid-latitude desert |
|
|
|
BSk |
Mid-latitude steppe |
Mid-latitude dry |
|
C |
Mild Mid-Latitude |
Csa |
Mediterranean |
Mild with dry, hot summer |
|
|
|
Csb |
Mediterranean |
Mild with dry, warm summer |
|
|
|
Cfa |
Humid subtropical |
Mild with no dry season, hot summer |
|
|
|
Cwa |
Humid subtropical |
Mild with dry winter, hot summer |
|
|
|
Cfb |
Marine west coast |
Mild with no dry season, warm summer |
|
|
|
Cfc |
Marine west coast |
Mild with no dry season, cool summer |
|
D |
Severe Mid-Latitude |
Dfa |
Humid continental |
Humid with severe winter, no dry season, hot summer |
|
|
|
Dfb |
Humid continental |
Humid with severe winter, no dry season, warm summer |
|
|
|
Dwa |
Humid continental |
Humid with severe, dry winter, hot summer |
|
|
|
Dwb |
Humid continental |
Humid with severe, dry winter, warm summer |
|
|
|
Dfc |
Subarctic |
Severe winter, no dry season, cool summer |
|
|
|
Dfd |
Subarctic |
Severe, very cold winter, no dry season, cool summer |
|
|
|
Dwc |
Subarctic |
Severe, dry winter, cool summer |
|
|
|
Dwd |
Subarctic |
Severe, very cold and dry winter, cool summer |
|
E |
Polar |
ET |
Tundra |
Polar tundra, no true summer |
|
|
|
EF |
Ice Cap |
Perennial ice |
|
H |
Highland |
|
Mountain climate |
Contains all highland areas not easily categorized by other climate types |
Light (Solar Radiation - Amount and Photoperiod)
Plant growth responses to solar radiation can be separated into those due to wavelength or color, light intensity, and duration (photoperiod). Photosynthesis is most activated by radiation in the visible range. Photosynthetically active radiation (PAR) has wavelengths of; 400-700 nm). The relative ratio of radiation in the red and far-red regions of the spectrum control plant photoperiod responses such as flowering. Radiation density is measured in energy units (µmoles photons/m2/s). Although the growth rate of plants with adequate nutrition and water is directly related to radiation density, forage growth rate is more often related to percent radiation interception by leaves. A full canopy of leaf blades intercepts maximum radiation. Thus, moderate defoliation optimizes plant growth.
Duration of the photoperiod (the time from sunrise to sunset) changes with latitude and season due to the tilt of the earth relative to its path around the sun. Minimal seasonal change occurs at the equator whereas great changes occur at the poles. Most temperate grasses and legumes flower during long photoperiods; the flowering of perennial grasses also requires vernalization caused by cold temperatures.
Temperature
Growth rate and other processes depend on the temperature pattern, including daylength variation. Near optimum daytime temperatures promote photosynthesis and growth; lower temperatures at night conserve plant energy by reducing respiration. Optimal cool-season forages growth occurs at temperatures near 70 ⁰ F (21.1 ⁰ C), although these forages can still grow slowly near 35 ⁰ F (1.9 ⁰ C). Optimal warm-season forage growth occurs at temperatures near 90 ⁰ F (32.2 ⁰ C); these forages grow little below 60 ⁰ F (15.6 ⁰ C). Higher temperatures increase the rate of plant development and decrease the time from seeding to flowering. This is one reason forage yields of cool-season species such as alfalfa and red clover are lower during hot summer periods. Cool-season forages have less time to produce stem and leaf growth when warmer temperatures speed flowering.
Temperatures above or below the optimal range stress plants. High-temperature stress often coincides with moisture stress. Excessively high temperatures can induce flower sterility, especially pollen abortion, and lead to poor seed production.
Low-temperature stress can cause chilling injury in warm-season grasses and some legumes, but most cool-season legumes and grasses are not sensitive to above-freezing temperatures. Most cool-season grasses accumulate fructan, a carbohydrate, in cell vacuoles, whereas legumes and warm-season grasses store starch in chloroplasts. At low temperatures, plants continue to synthesize and break down fructan more readily than starch. This difference in metabolism between the cool- and warm-season grasses is the reason that each type thrives in its preferred temperature range.
Forage species differ widely in their ability to withstand cold temperatures. Differences within species (among types and cultivars) also exist. Overwintering species gradually develop cold resistance with the onset of the shorter days and cooler autumn temperatures. Forages lose cold resistance much faster than they gain it. Most winter killing in the northern areas occurs during late winter and early spring when insulating snow cover has disappeared and plants are exposed to severe temperature fluctuations above and below freezing.
Water Relations
Seasonal variation in precipitation, total precipitation, and evapotranspiration affect water availability and adaptation of forage species. In addition, available water in the soil depends on soil texture and depth. Solar radiation is the primary driver of transpiration.
Limited water. Shoot growth slows well before water stress becomes severe enough to cause stomatal closure and a decline in photosynthesis. Sugars from photosynthesis often accumulate during mild to moderate drought stress because growth is slowed. Some forage species gain drought tolerance by accumulating solutes like sugars, amino acids, and ions that hold water in plant tissues and prevent injury.
Forage species differ in response to drought stress. Many plants reduce shoot growth but maintain root growth under moderate drought stress conditions. Deep-rooted plants minimize drought stress due to greater access to water stored more deeply in the soil profile.
Excessive water. Poorly drained soils provide an unfavorable environment for growth of many forage species, especially legumes. (See Soils section)
Climate information slightly revised from: Volenec, Jeffrey J. and C. Jerry Nelson. 2003. Environmental Aspects of Forage Management. p. 99-124. Chapter 4 In: Robert F. Barnes, C. Jerry Nelson, Michael Collins, and Kenneth J. Moore (eds.) Forages: An Introduction to Grassland Agriculture. 6th ed. Vol. 1. Iowa State Press.
Clover Species Climate Tolerance Table [[{"fid":"1656","view_mode":"default","fields":{"format":"default","alignment":"","field_file_image_alt_text[und][0][value]":"Clover Climatic Tolerances Table","field_file_image_title_text[und][0][value]":"Clover Climatic Tolerances Table","external_url":""},"type":"media","field_deltas":{"10":{"format":"default","alignment":"","field_file_image_alt_text[und][0][value]":"Clover Climatic Tolerances Table","field_file_image_title_text[und][0][value]":"Clover Climatic Tolerances Table","external_url":""}},"link_text":null,"attributes":{"alt":"Clover Climatic Tolerances Table","title":"Clover Climatic Tolerances Table","height":478,"width":522,"class":"media-element file-default","data-delta":"10"}}]]
USDA Plant Hardiness Zone Map
http://planthardiness.ars.usda.gov/PHZMWeb/

PRISM Conterminous US Climate Maps: 30-Year Normals
http://www.prism.oregonstate.edu/normals/
- January Mean Minimum:
Image

- July Mean Maximum:
Image

- Annual Precipitation:
Image